| __timestamp | CDW Corporation | Cisco Systems, Inc. |
|---|---|---|
| Wednesday, January 1, 2014 | 12074500000 | 47142000000 |
| Thursday, January 1, 2015 | 12988700000 | 49161000000 |
| Friday, January 1, 2016 | 13981900000 | 49247000000 |
| Sunday, January 1, 2017 | 15191500000 | 48005000000 |
| Monday, January 1, 2018 | 16240500000 | 49330000000 |
| Tuesday, January 1, 2019 | 18032400000 | 51904000000 |
| Wednesday, January 1, 2020 | 18467500000 | 49301000000 |
| Friday, January 1, 2021 | 20820800000 | 49818000000 |
| Saturday, January 1, 2022 | 23748700000 | 51557000000 |
| Sunday, January 1, 2023 | 21376000000 | 56998000000 |
| Monday, January 1, 2024 | 20998700000 | 53803000000 |
Igniting the spark of knowledge
In the ever-evolving landscape of technology, Cisco Systems, Inc. and CDW Corporation have been pivotal players. Over the past decade, Cisco has consistently demonstrated its dominance, with revenue figures peaking at approximately $57 billion in 2023, marking a 21% increase since 2014. Meanwhile, CDW has shown impressive growth, with its revenue surging by nearly 77% over the same period, reaching around $21 billion in 2023. This remarkable growth trajectory highlights CDW's strategic expansion and market penetration.
However, 2024 presents a curious anomaly with missing data for CDW, leaving analysts speculating about potential market shifts or reporting delays. As these two titans continue to shape the tech industry, their financial journeys offer valuable insights into the dynamics of revenue growth and market leadership.
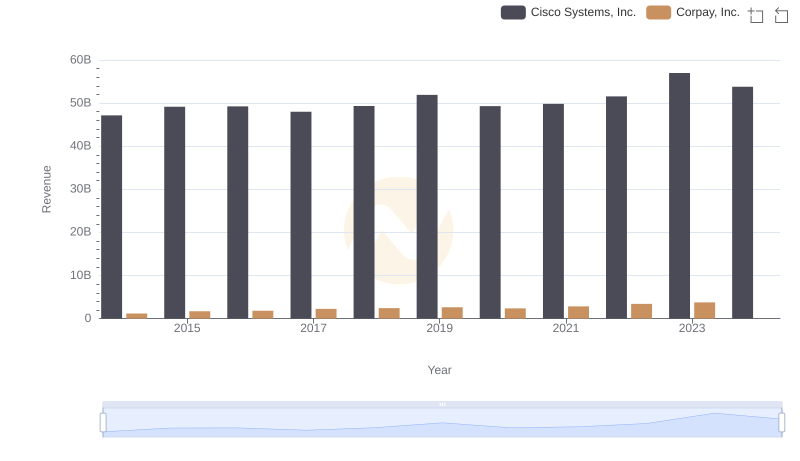
Revenue Showdown: Cisco Systems, Inc. vs Corpay, Inc.
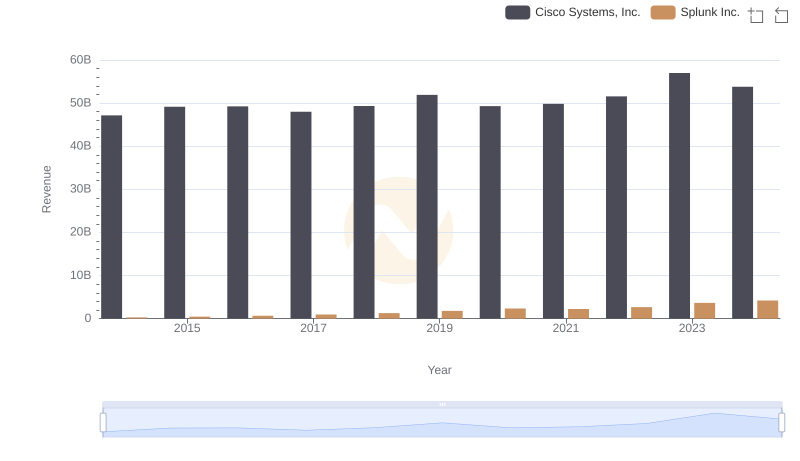
Cisco Systems, Inc. vs Splunk Inc.: Annual Revenue Growth Compared
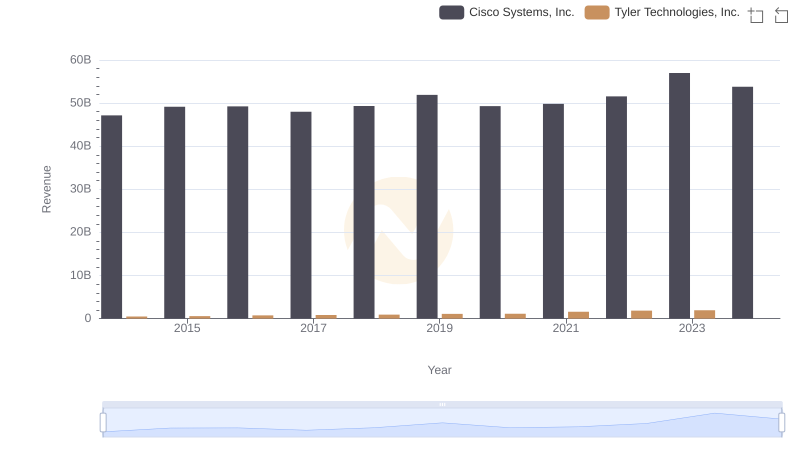
Cisco Systems, Inc. vs Tyler Technologies, Inc.: Annual Revenue Growth Compared

Cisco Systems, Inc. vs Telefonaktiebolaget LM Ericsson (publ): Examining Key Revenue Metrics
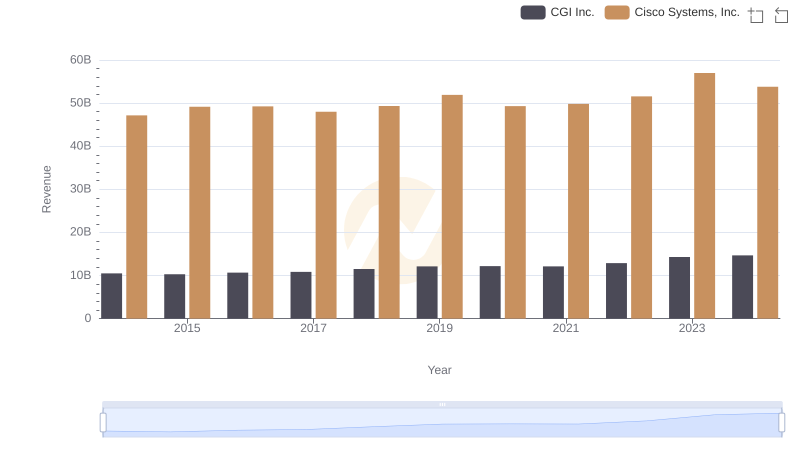
Revenue Insights: Cisco Systems, Inc. and CGI Inc. Performance Compared
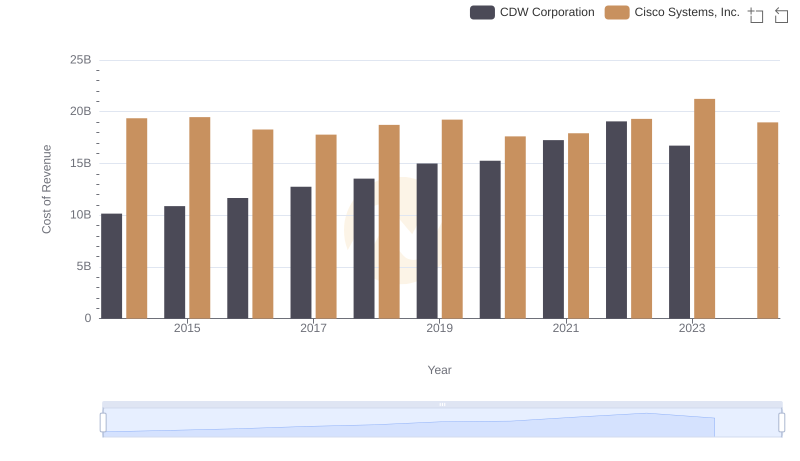
Comparing Cost of Revenue Efficiency: Cisco Systems, Inc. vs CDW Corporation
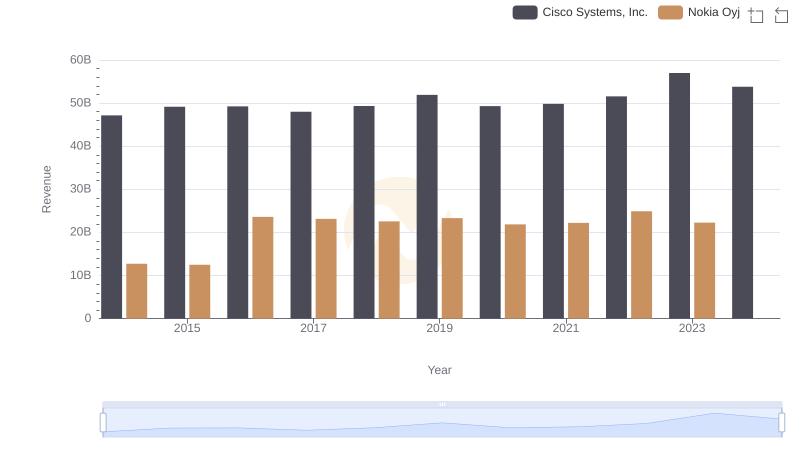
Cisco Systems, Inc. vs Nokia Oyj: Examining Key Revenue Metrics
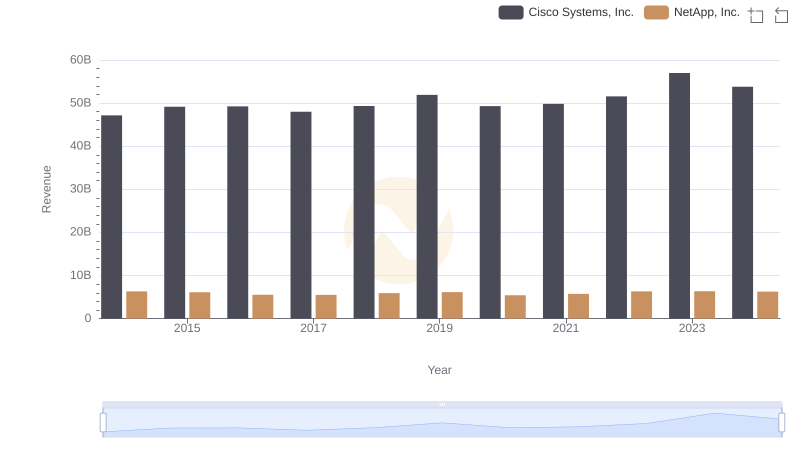
Who Generates More Revenue? Cisco Systems, Inc. or NetApp, Inc.
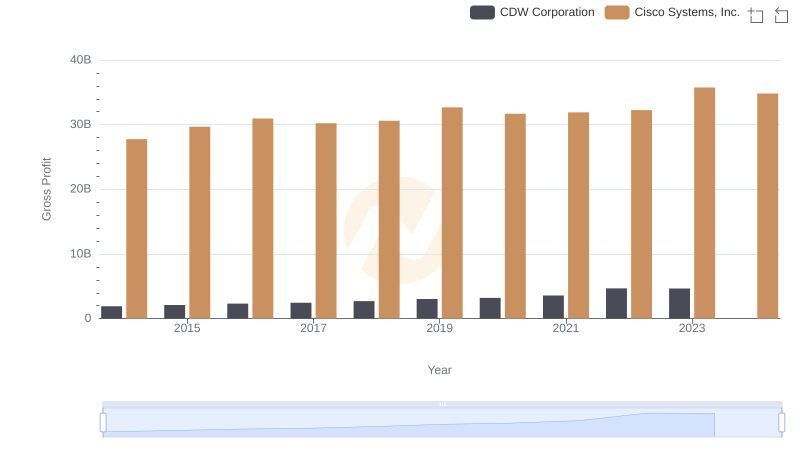
Cisco Systems, Inc. vs CDW Corporation: A Gross Profit Performance Breakdown
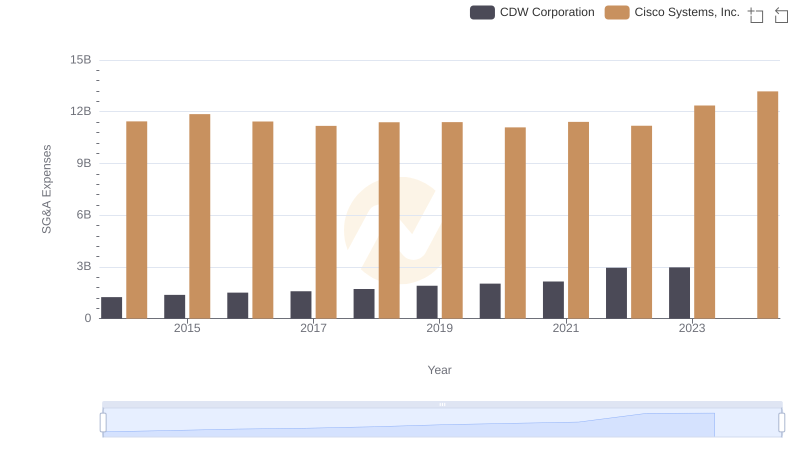
Cisco Systems, Inc. or CDW Corporation: Who Manages SG&A Costs Better?
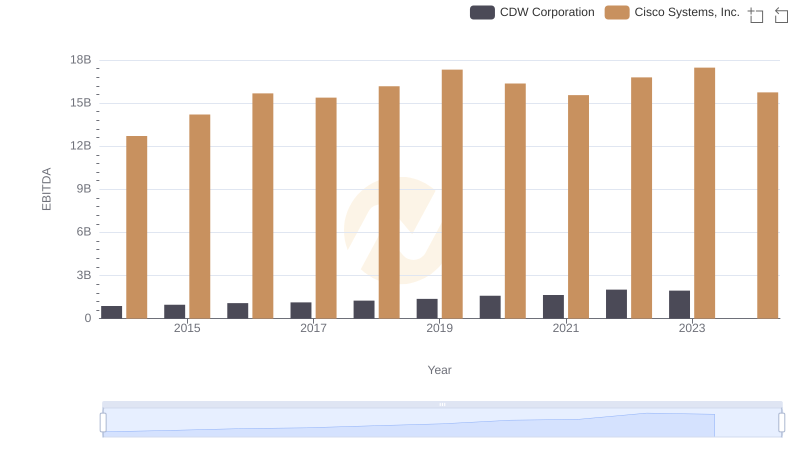
A Side-by-Side Analysis of EBITDA: Cisco Systems, Inc. and CDW Corporation