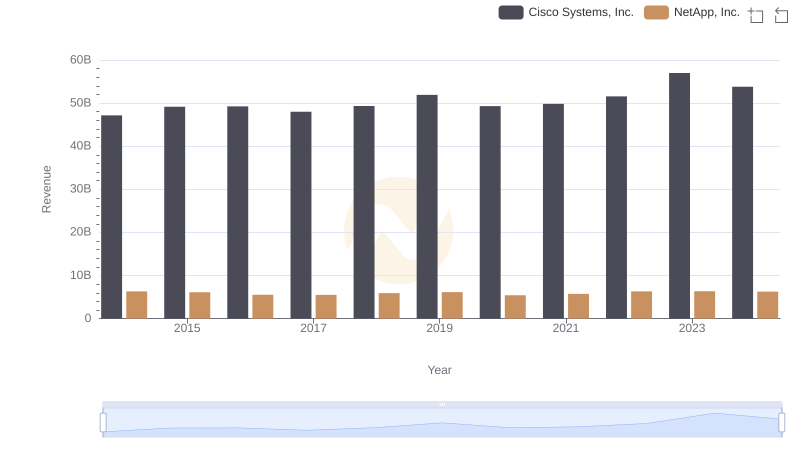
| __timestamp | Cisco Systems, Inc. | NetApp, Inc. |
|---|---|---|
| Wednesday, January 1, 2014 | 19373000000 | 2406000000 |
| Thursday, January 1, 2015 | 19480000000 | 2289500000 |
| Friday, January 1, 2016 | 18287000000 | 2173000000 |
| Sunday, January 1, 2017 | 17781000000 | 2129000000 |
| Monday, January 1, 2018 | 18724000000 | 2212000000 |
| Tuesday, January 1, 2019 | 19238000000 | 2201000000 |
| Wednesday, January 1, 2020 | 17618000000 | 1789000000 |
| Friday, January 1, 2021 | 17924000000 | 1929000000 |
| Saturday, January 1, 2022 | 19309000000 | 2098000000 |
| Sunday, January 1, 2023 | 21245000000 | 2153000000 |
| Monday, January 1, 2024 | 18975000000 | 1835000000 |
In pursuit of knowledge
In the ever-evolving tech industry, cost efficiency is a critical metric for success. Cisco Systems, Inc. and NetApp, Inc., two stalwarts in the field, have shown distinct trends in their cost of revenue from 2014 to 2024. Cisco's cost of revenue has seen a slight decline, averaging around $18.9 billion annually, with a notable peak in 2023. This represents a 10% increase from its lowest point in 2020. Meanwhile, NetApp's cost of revenue has remained relatively stable, averaging $2.1 billion, with a 24% decrease from its peak in 2014 to its lowest in 2020. These trends highlight Cisco's ability to manage costs more dynamically, while NetApp maintains a steady approach. As the tech landscape continues to shift, these companies' strategies in cost management will be pivotal in maintaining their competitive edge.
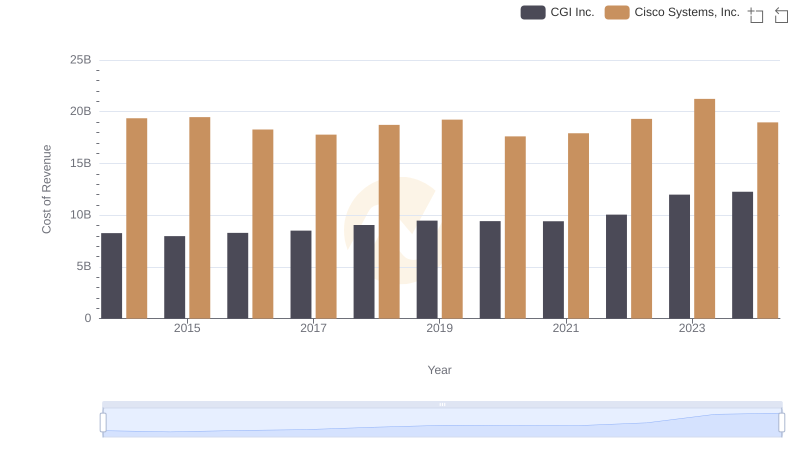
Cisco Systems, Inc. vs CGI Inc.: Efficiency in Cost of Revenue Explored
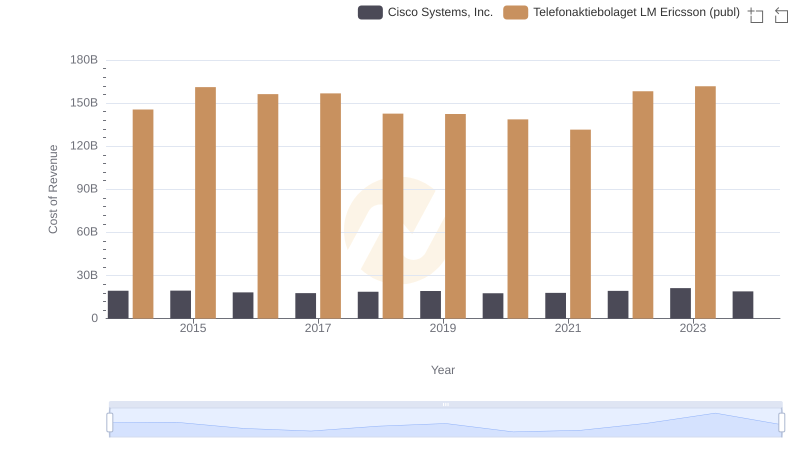
Cost of Revenue: Key Insights for Cisco Systems, Inc. and Telefonaktiebolaget LM Ericsson (publ)
Who Generates More Revenue? Cisco Systems, Inc. or NetApp, Inc.
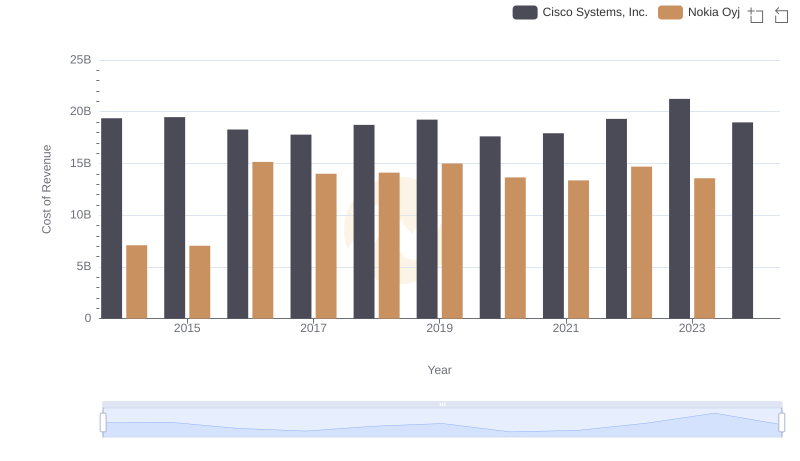
Cost Insights: Breaking Down Cisco Systems, Inc. and Nokia Oyj's Expenses
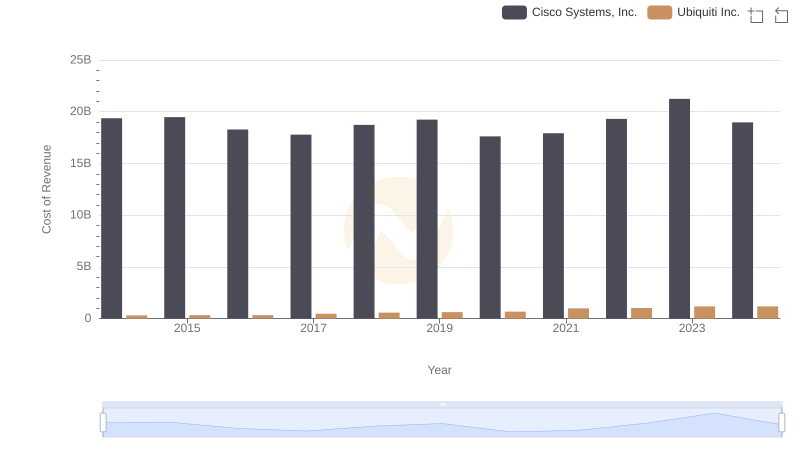
Cost of Revenue Trends: Cisco Systems, Inc. vs Ubiquiti Inc.
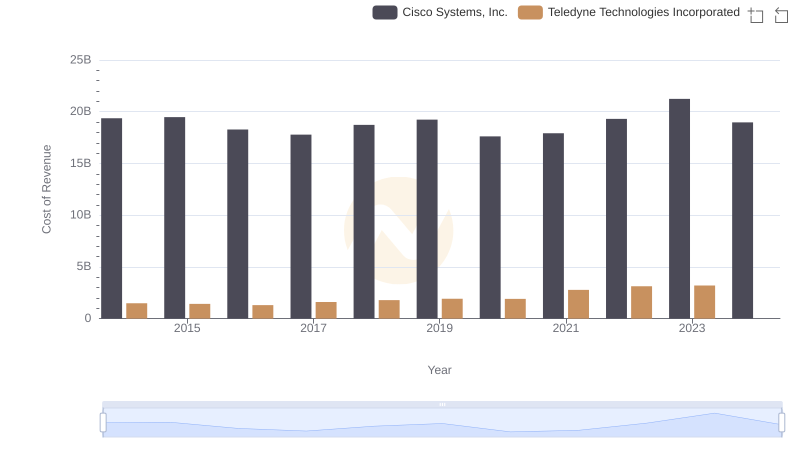
Cost of Revenue Comparison: Cisco Systems, Inc. vs Teledyne Technologies Incorporated
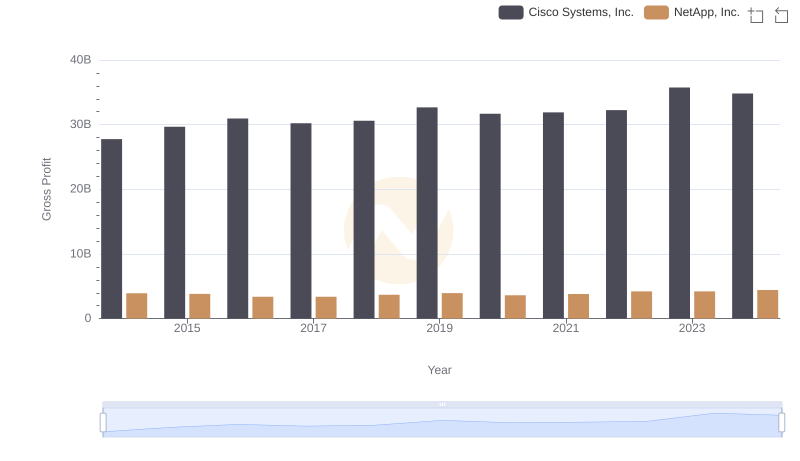
Gross Profit Analysis: Comparing Cisco Systems, Inc. and NetApp, Inc.
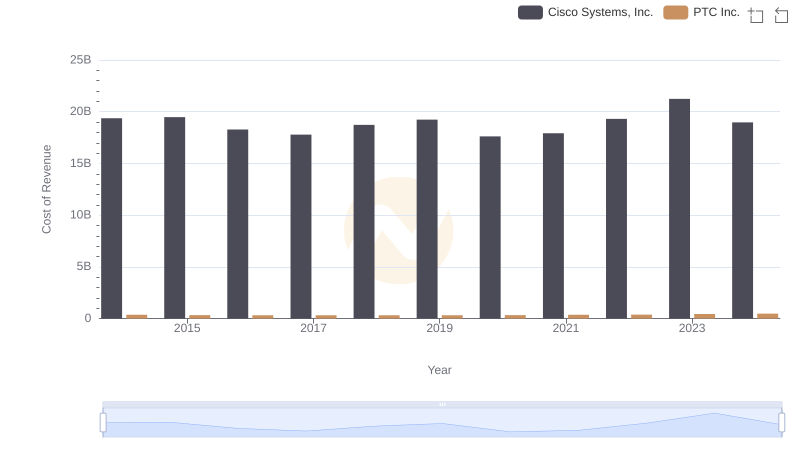
Cost Insights: Breaking Down Cisco Systems, Inc. and PTC Inc.'s Expenses
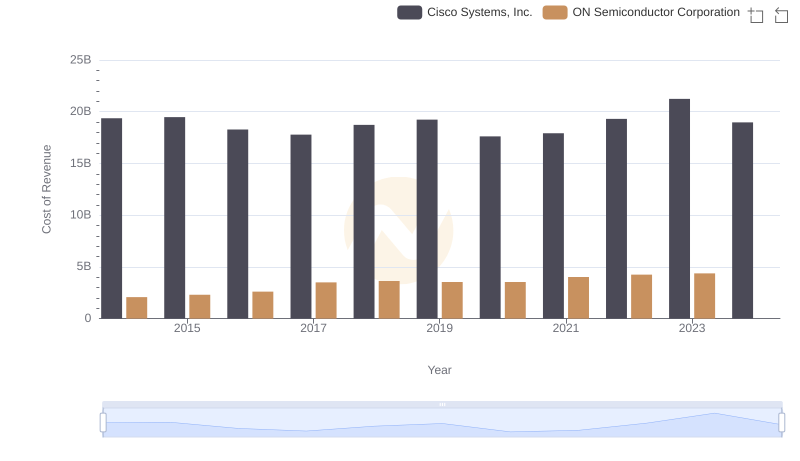
Cost of Revenue Trends: Cisco Systems, Inc. vs ON Semiconductor Corporation
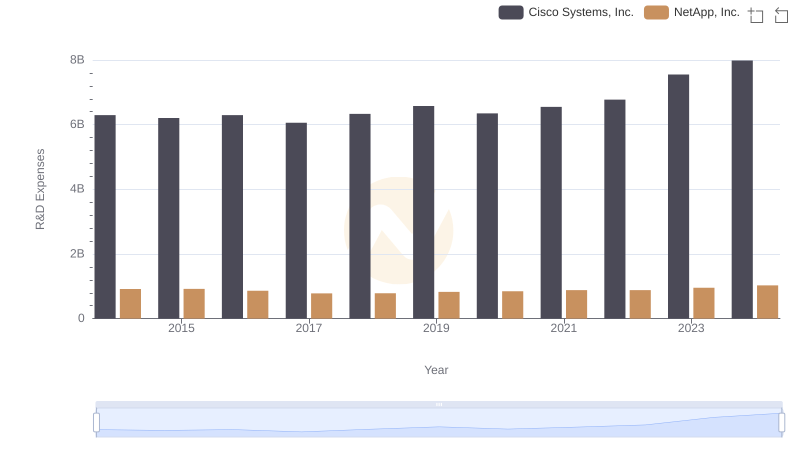
R&D Spending Showdown: Cisco Systems, Inc. vs NetApp, Inc.
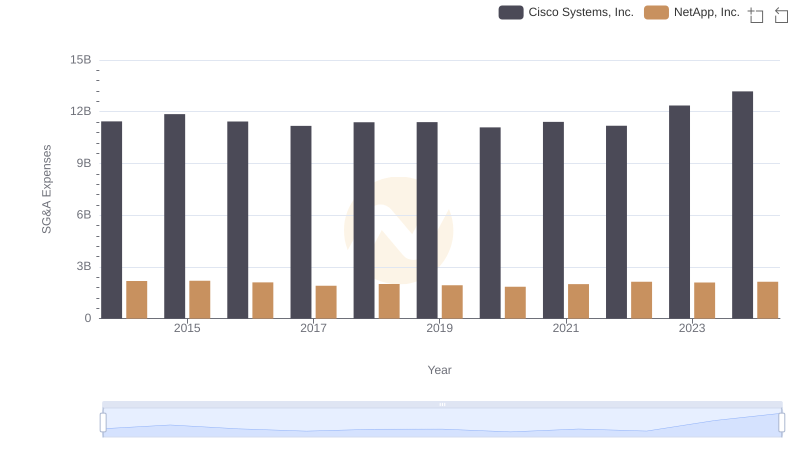
Cost Management Insights: SG&A Expenses for Cisco Systems, Inc. and NetApp, Inc.
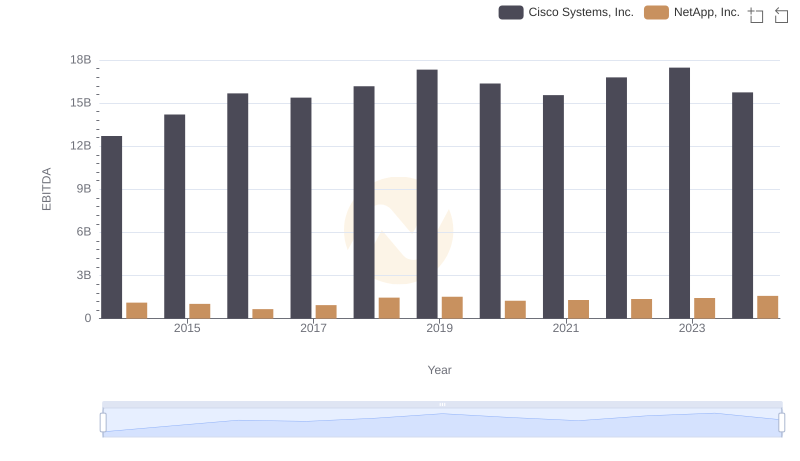
A Side-by-Side Analysis of EBITDA: Cisco Systems, Inc. and NetApp, Inc.