| __timestamp | CDW Corporation | Cisco Systems, Inc. |
|---|---|---|
| Wednesday, January 1, 2014 | 1921300000 | 27769000000 |
| Thursday, January 1, 2015 | 2115800000 | 29681000000 |
| Friday, January 1, 2016 | 2327200000 | 30960000000 |
| Sunday, January 1, 2017 | 2449900000 | 30224000000 |
| Monday, January 1, 2018 | 2706900000 | 30606000000 |
| Tuesday, January 1, 2019 | 3039900000 | 32666000000 |
| Wednesday, January 1, 2020 | 3210100000 | 31683000000 |
| Friday, January 1, 2021 | 3568500000 | 31894000000 |
| Saturday, January 1, 2022 | 4686600000 | 32248000000 |
| Sunday, January 1, 2023 | 4652400001 | 35753000000 |
| Monday, January 1, 2024 | 4602400000 | 34828000000 |
Unveiling the hidden dimensions of data
In the ever-evolving tech landscape, Cisco Systems, Inc. and CDW Corporation have emerged as formidable players. Over the past decade, Cisco's gross profit has consistently dwarfed that of CDW, averaging around 10 times higher. From 2014 to 2023, Cisco's gross profit surged by approximately 29%, peaking in 2023. Meanwhile, CDW's gross profit witnessed a remarkable 142% growth, reflecting its aggressive market expansion.
Despite Cisco's dominance, CDW's growth trajectory is noteworthy, especially in 2022, where it recorded its highest gross profit, marking a 32% increase from the previous year. However, 2024 data for CDW remains elusive, leaving room for speculation on its future performance. This comparison not only highlights the competitive dynamics between these two tech titans but also underscores the broader trends shaping the industry.
Stay tuned as we continue to track these industry leaders and their financial journeys.
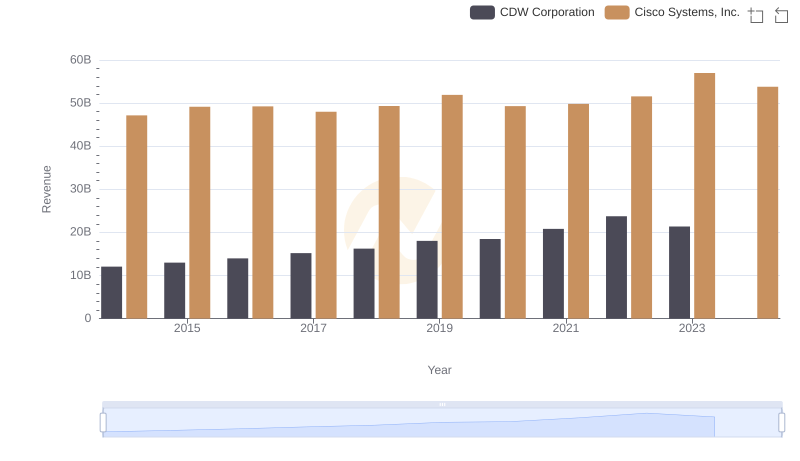
Cisco Systems, Inc. vs CDW Corporation: Annual Revenue Growth Compared
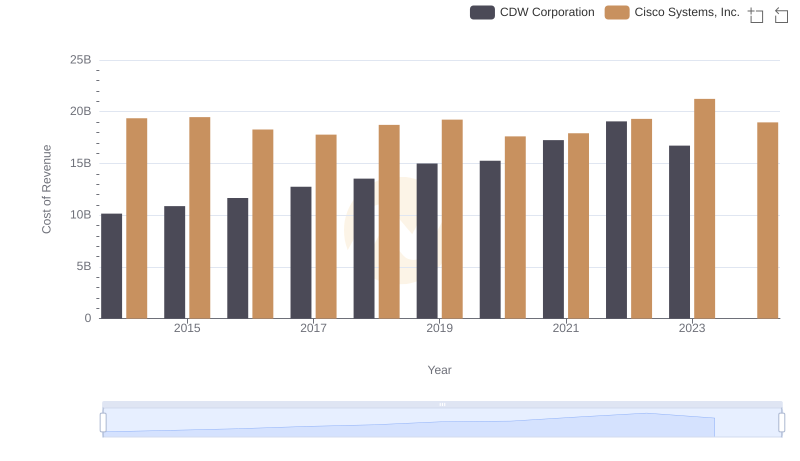
Comparing Cost of Revenue Efficiency: Cisco Systems, Inc. vs CDW Corporation
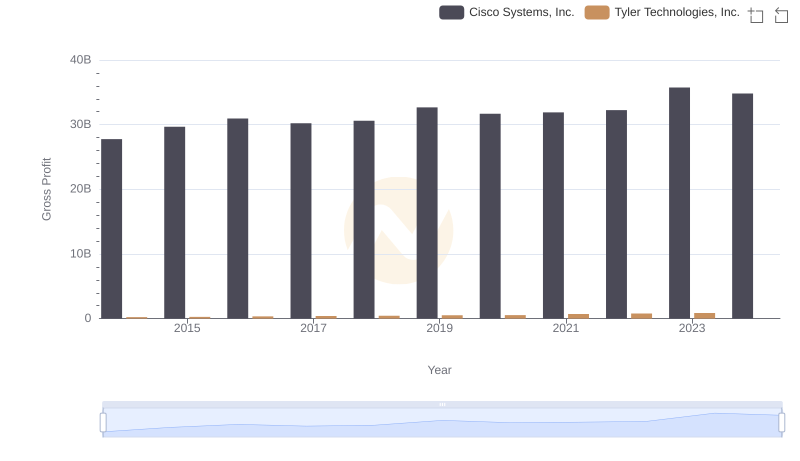
Gross Profit Analysis: Comparing Cisco Systems, Inc. and Tyler Technologies, Inc.
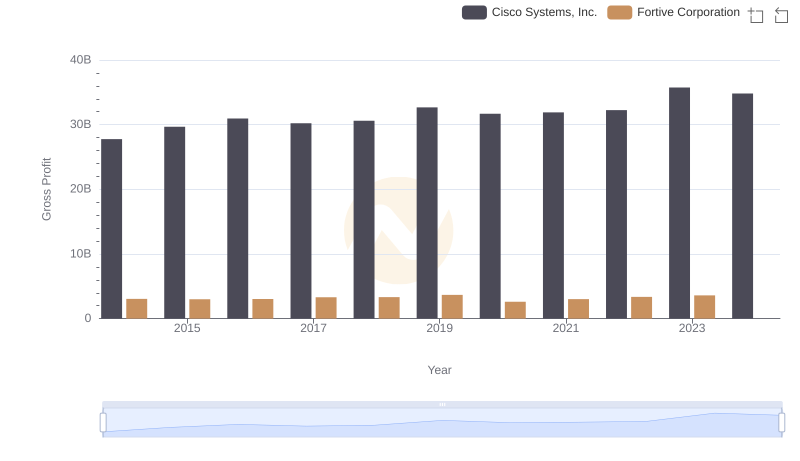
Key Insights on Gross Profit: Cisco Systems, Inc. vs Fortive Corporation
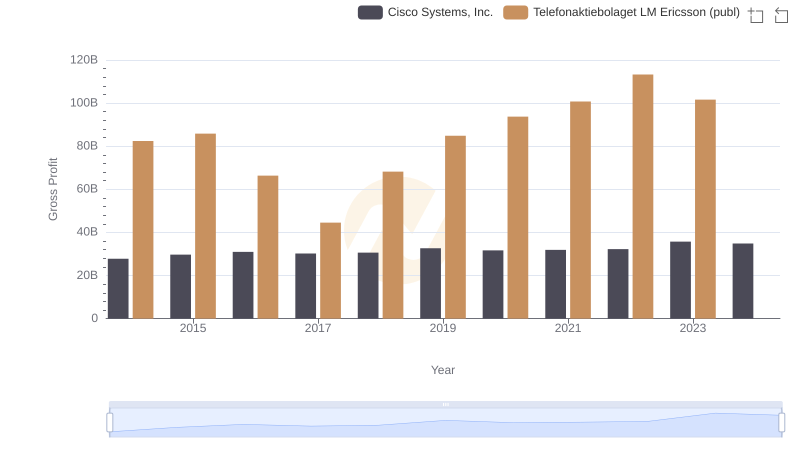
Cisco Systems, Inc. vs Telefonaktiebolaget LM Ericsson (publ): A Gross Profit Performance Breakdown
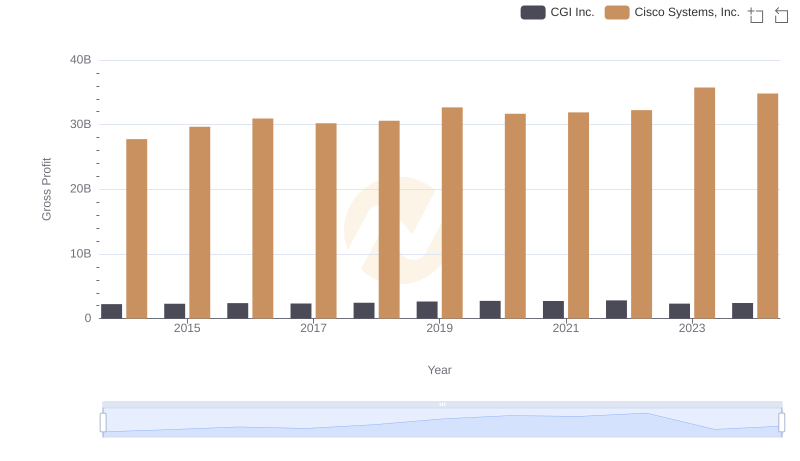
Key Insights on Gross Profit: Cisco Systems, Inc. vs CGI Inc.
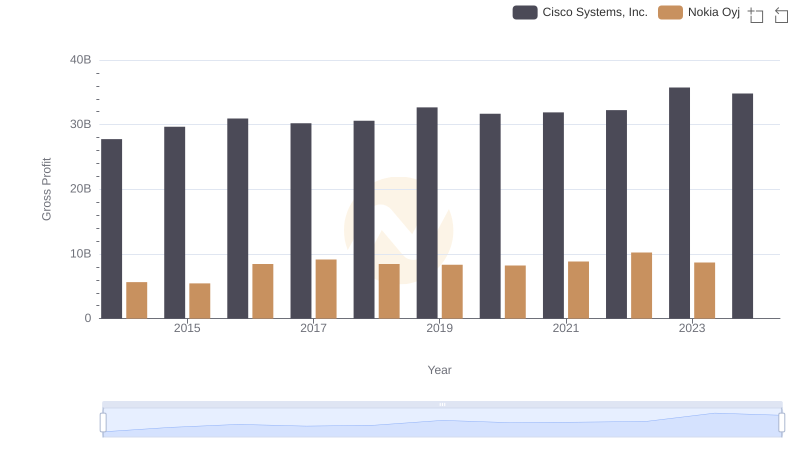
Gross Profit Comparison: Cisco Systems, Inc. and Nokia Oyj Trends
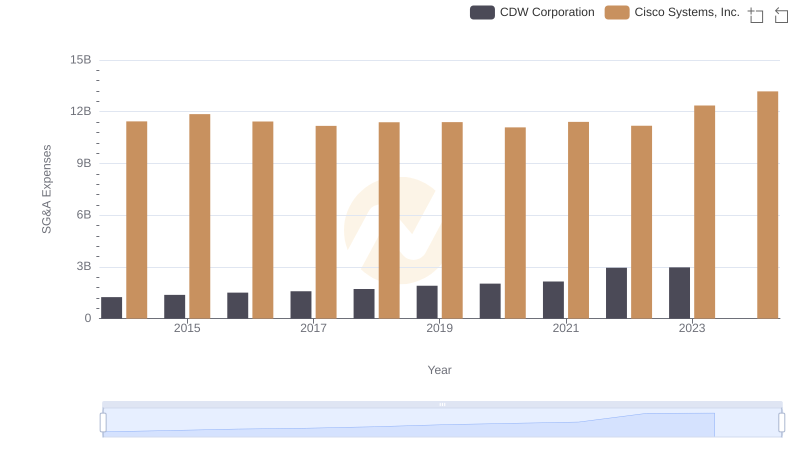
Cisco Systems, Inc. or CDW Corporation: Who Manages SG&A Costs Better?
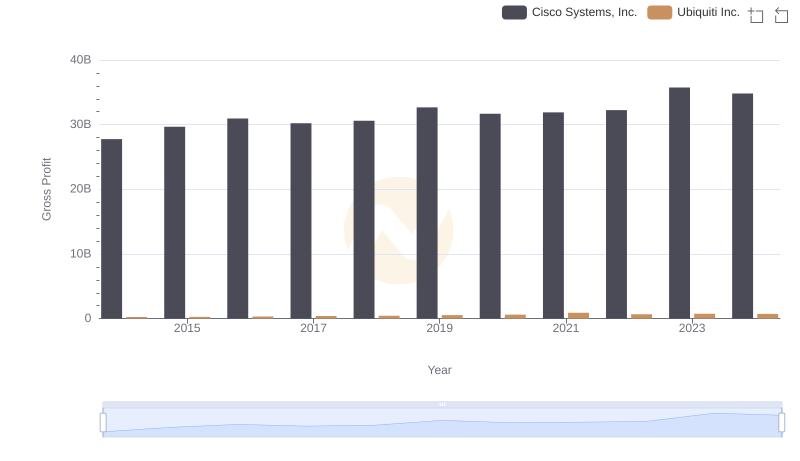
Cisco Systems, Inc. and Ubiquiti Inc.: A Detailed Gross Profit Analysis
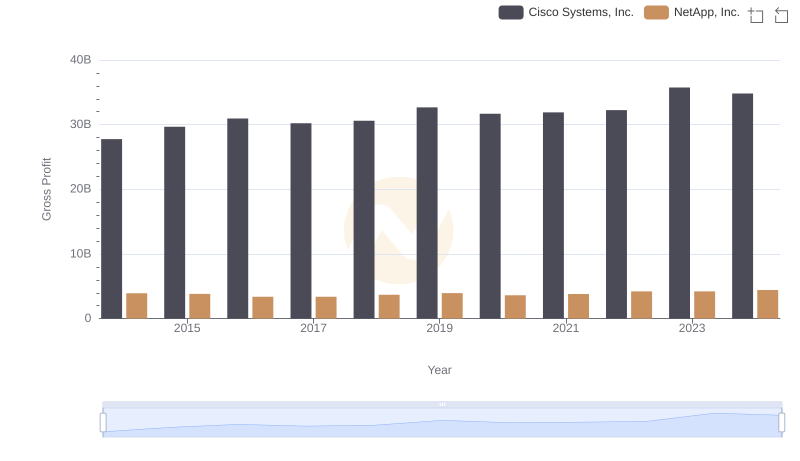
Gross Profit Analysis: Comparing Cisco Systems, Inc. and NetApp, Inc.
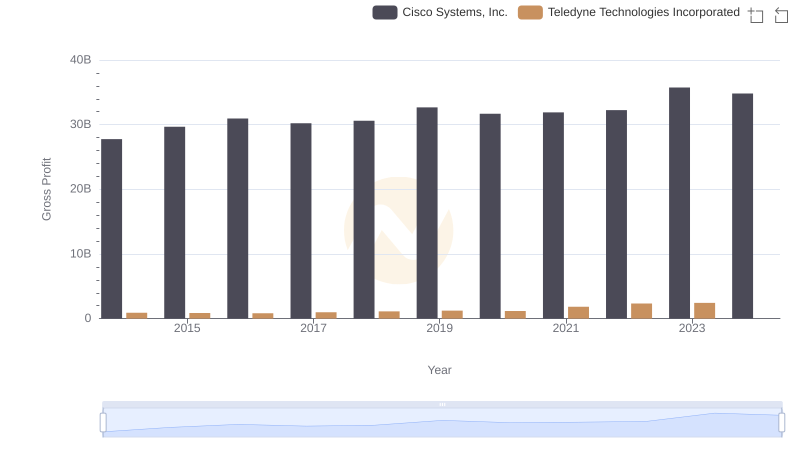
Gross Profit Trends Compared: Cisco Systems, Inc. vs Teledyne Technologies Incorporated
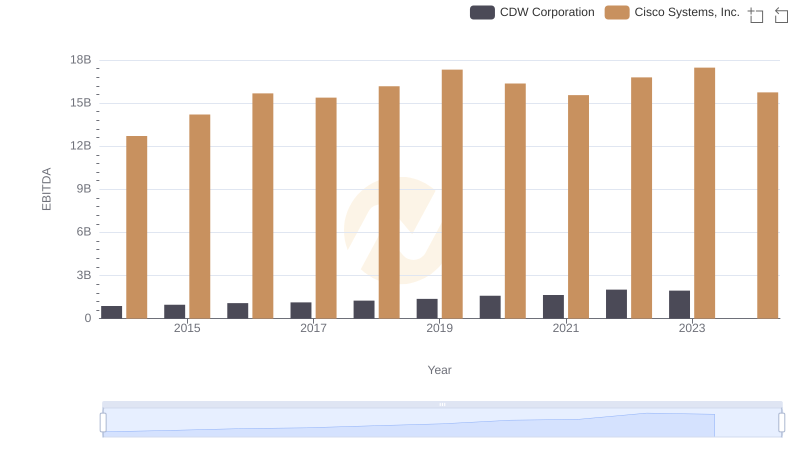
A Side-by-Side Analysis of EBITDA: Cisco Systems, Inc. and CDW Corporation