| __timestamp | Cisco Systems, Inc. | Splunk Inc. |
|---|---|---|
| Wednesday, January 1, 2014 | 19373000000 | 35825000 |
| Thursday, January 1, 2015 | 19480000000 | 68378000 |
| Friday, January 1, 2016 | 18287000000 | 114122000 |
| Sunday, January 1, 2017 | 17781000000 | 191053000 |
| Monday, January 1, 2018 | 18724000000 | 256409000 |
| Tuesday, January 1, 2019 | 19238000000 | 344676000 |
| Wednesday, January 1, 2020 | 17618000000 | 429788000 |
| Friday, January 1, 2021 | 17924000000 | 547345000 |
| Saturday, January 1, 2022 | 19309000000 | 733969000 |
| Sunday, January 1, 2023 | 21245000000 | 815995000 |
| Monday, January 1, 2024 | 18975000000 | 865507000 |
Unleashing the power of data
In the ever-evolving tech industry, understanding the cost of revenue is crucial for evaluating a company's financial health. Cisco Systems, Inc., a stalwart in networking technology, and Splunk Inc., a leader in data analytics, present an intriguing comparison. From 2014 to 2024, Cisco's cost of revenue has shown a steady trend, peaking in 2023 with a 10% increase from its 2014 figures. In contrast, Splunk's cost of revenue has skyrocketed, growing by over 2300% during the same period, reflecting its rapid expansion and investment in growth.
This analysis underscores the diverse strategies of these tech giants in navigating the competitive landscape.
Cost Insights: Breaking Down Cisco Systems, Inc. and II-VI Incorporated's Expenses
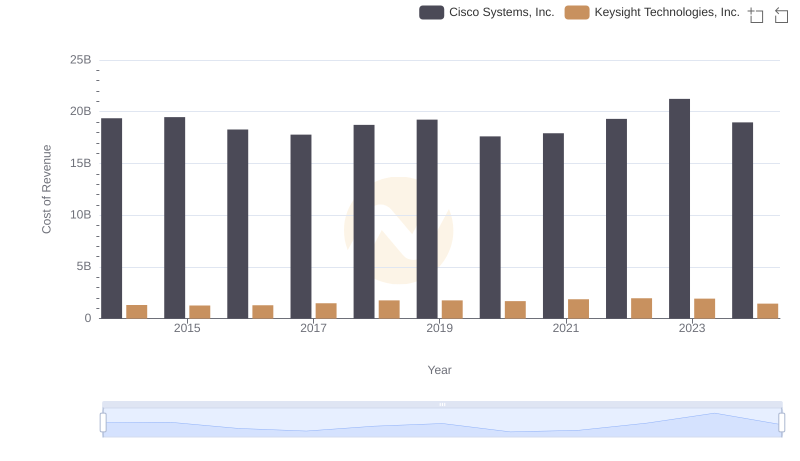
Cisco Systems, Inc. vs Keysight Technologies, Inc.: Efficiency in Cost of Revenue Explored
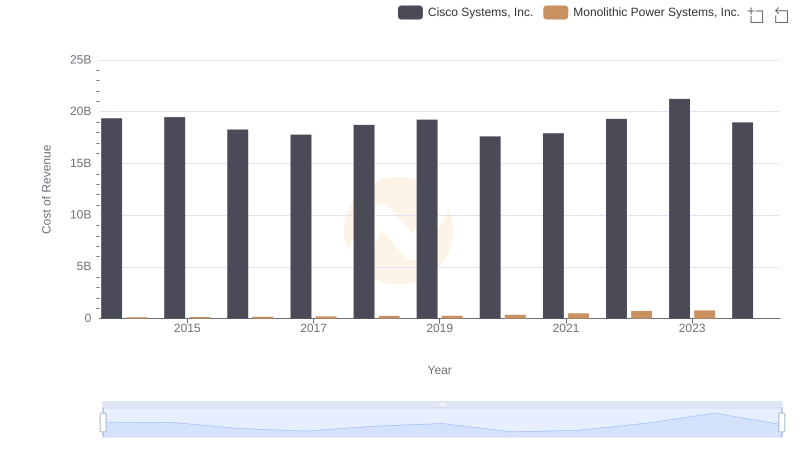
Comparing Cost of Revenue Efficiency: Cisco Systems, Inc. vs Monolithic Power Systems, Inc.
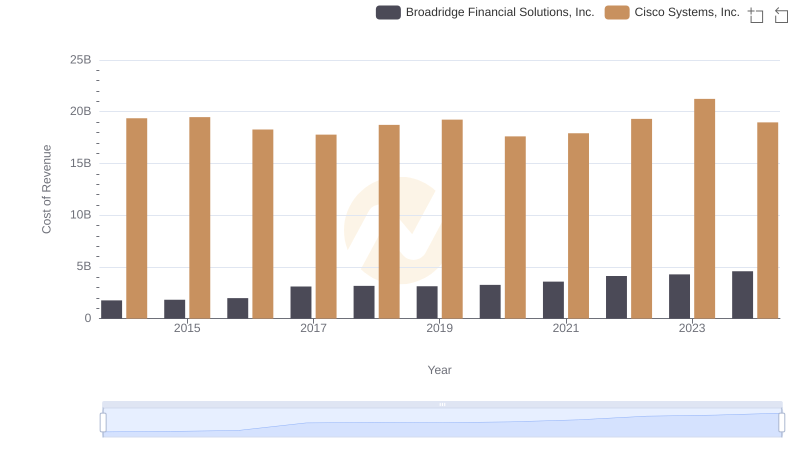
Analyzing Cost of Revenue: Cisco Systems, Inc. and Broadridge Financial Solutions, Inc.
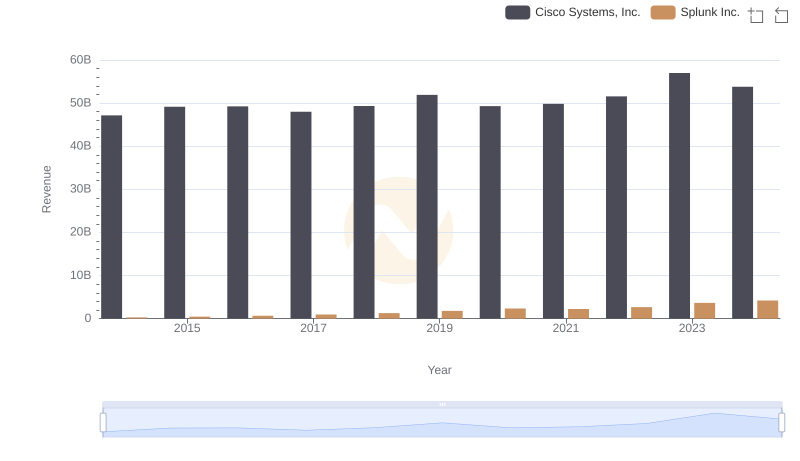
Cisco Systems, Inc. vs Splunk Inc.: Annual Revenue Growth Compared
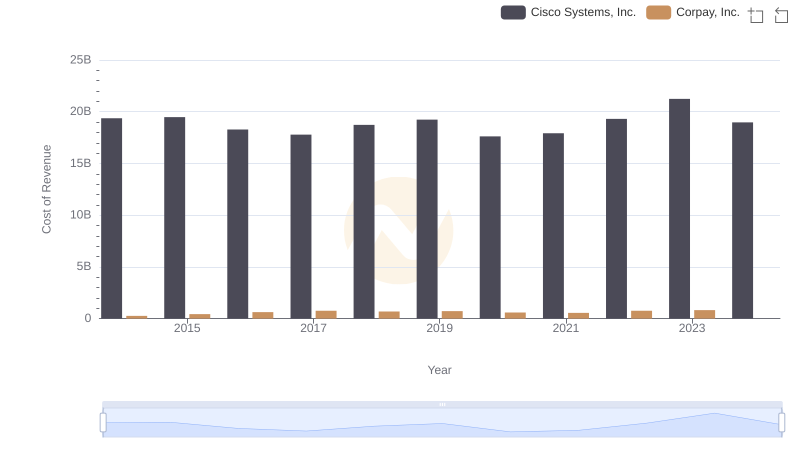
Cost of Revenue Comparison: Cisco Systems, Inc. vs Corpay, Inc.
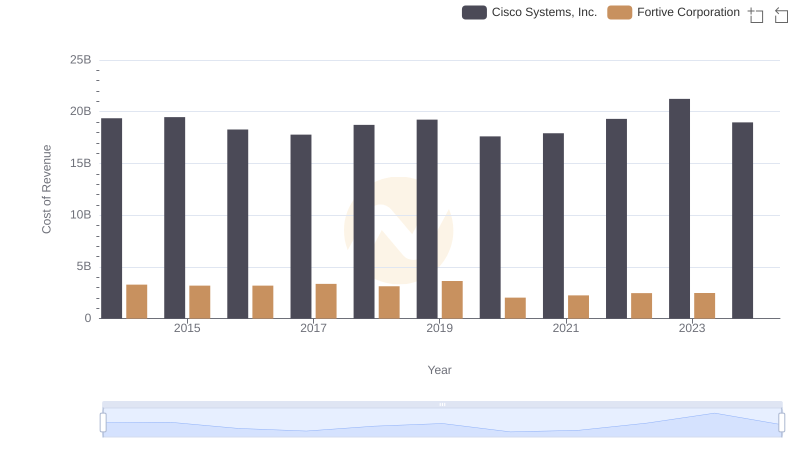
Comparing Cost of Revenue Efficiency: Cisco Systems, Inc. vs Fortive Corporation
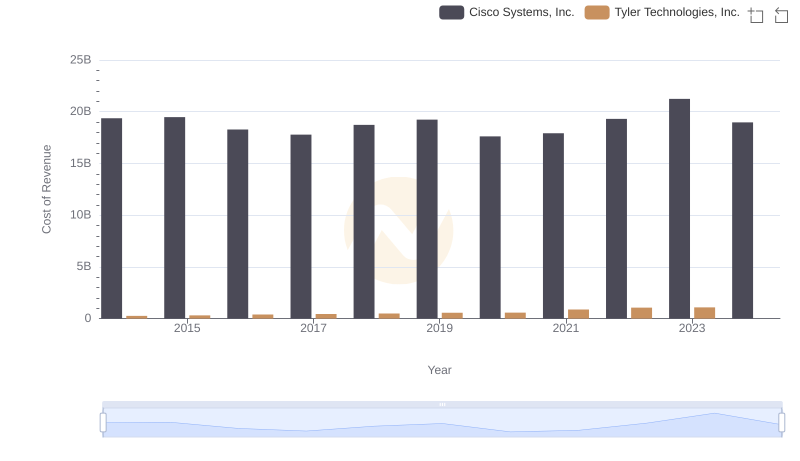
Cost of Revenue Trends: Cisco Systems, Inc. vs Tyler Technologies, Inc.
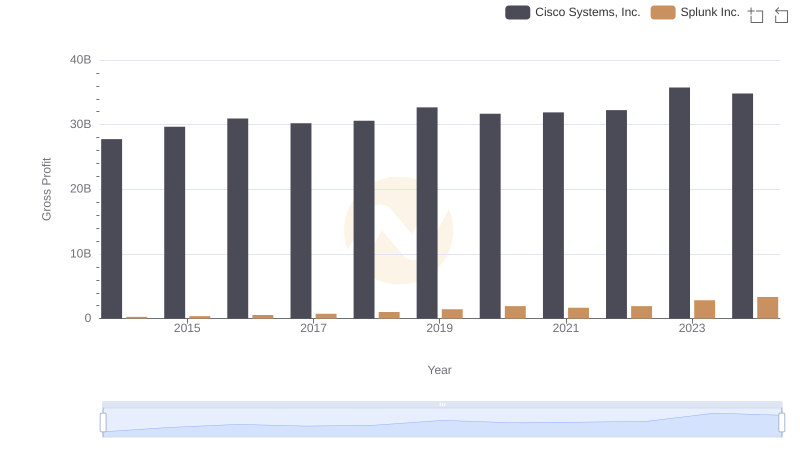
Gross Profit Comparison: Cisco Systems, Inc. and Splunk Inc. Trends
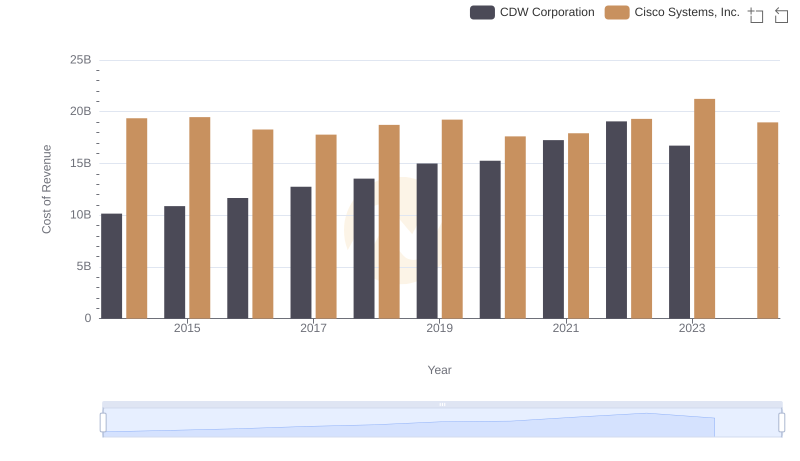
Comparing Cost of Revenue Efficiency: Cisco Systems, Inc. vs CDW Corporation
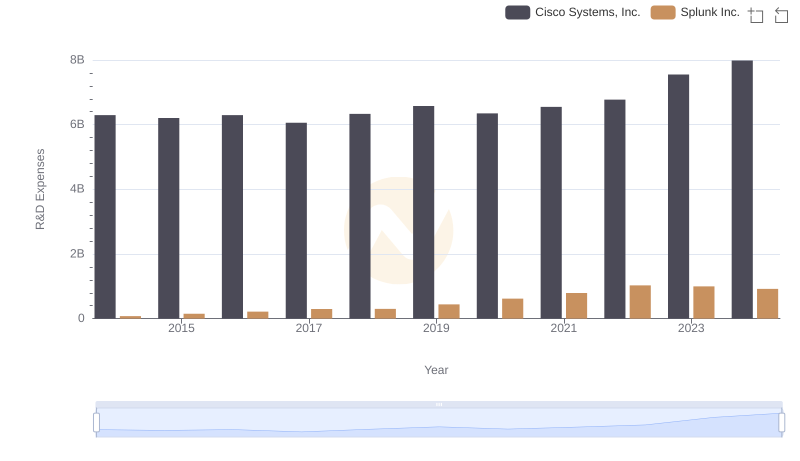
R&D Insights: How Cisco Systems, Inc. and Splunk Inc. Allocate Funds
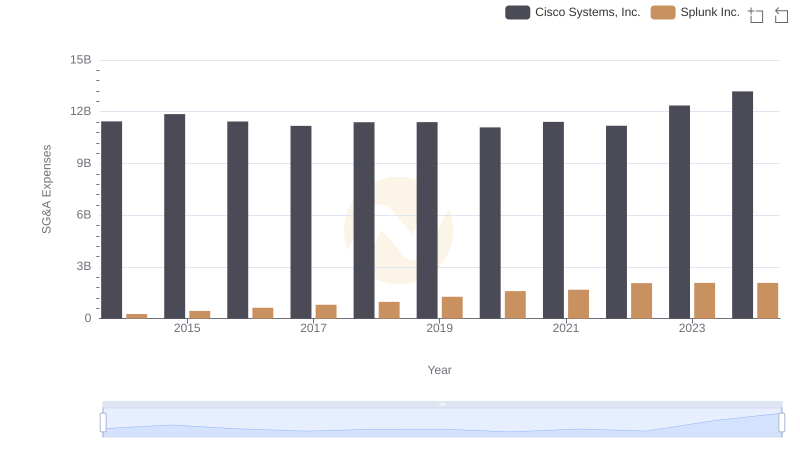
Comparing SG&A Expenses: Cisco Systems, Inc. vs Splunk Inc. Trends and Insights