| __timestamp | Fidelity National Information Services, Inc. | International Business Machines Corporation |
|---|---|---|
| Wednesday, January 1, 2014 | 4332700000 | 46386000000 |
| Thursday, January 1, 2015 | 4393200000 | 41057000000 |
| Friday, January 1, 2016 | 6233000000 | 41403000000 |
| Sunday, January 1, 2017 | 5794000000 | 42196000000 |
| Monday, January 1, 2018 | 5569000000 | 42655000000 |
| Tuesday, January 1, 2019 | 6610000000 | 26181000000 |
| Wednesday, January 1, 2020 | 8348000000 | 24314000000 |
| Friday, January 1, 2021 | 8682000000 | 25865000000 |
| Saturday, January 1, 2022 | 8820000000 | 27842000000 |
| Sunday, January 1, 2023 | 6145000000 | 27560000000 |
| Monday, January 1, 2024 | 6323000000 | 27202000000 |
Unleashing the power of data
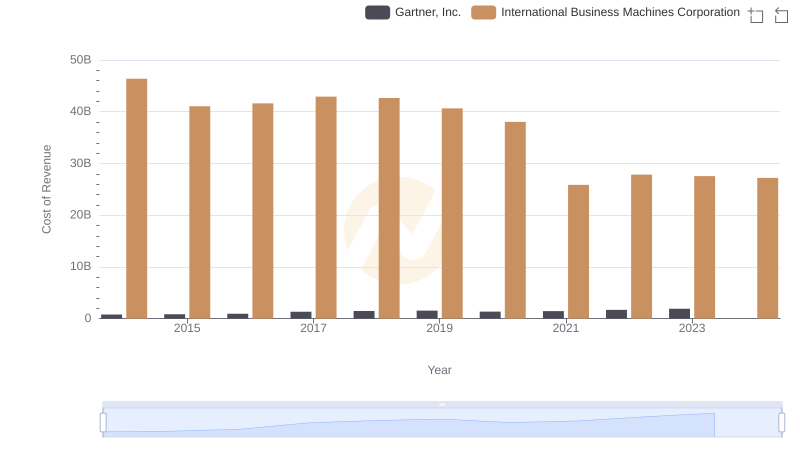
In the ever-evolving landscape of technology and financial services, understanding cost structures is crucial. From 2014 to 2023, International Business Machines Corporation (IBM) and Fidelity National Information Services, Inc. (FIS) have shown distinct trends in their cost of revenue. IBM, a stalwart in the tech industry, saw its cost of revenue decrease by approximately 41% over this period, reflecting strategic shifts and operational efficiencies. In contrast, FIS, a leader in financial services technology, experienced a 44% increase, highlighting its expansion and investment in new technologies.
The data reveals a pivotal moment in 2020 when FIS's cost of revenue surged by 26%, coinciding with global digital transformation trends. Meanwhile, IBM's costs dropped significantly in 2021, aligning with its focus on cloud computing and AI. Notably, 2024 data for FIS is missing, indicating potential reporting delays or strategic changes.
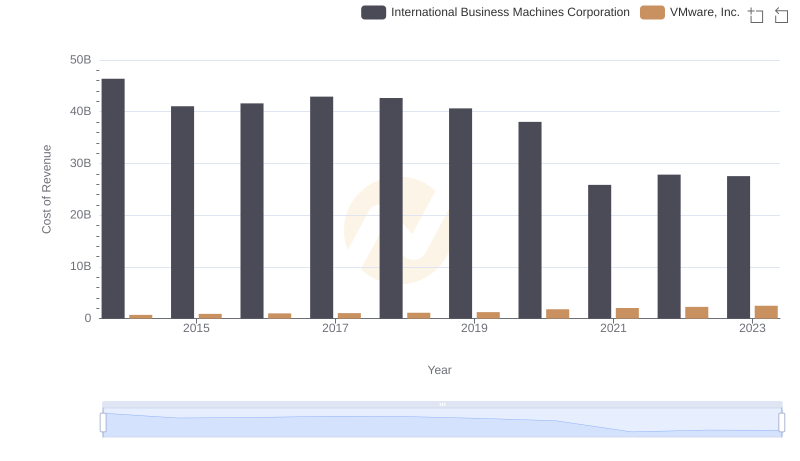
Cost of Revenue Trends: International Business Machines Corporation vs VMware, Inc.
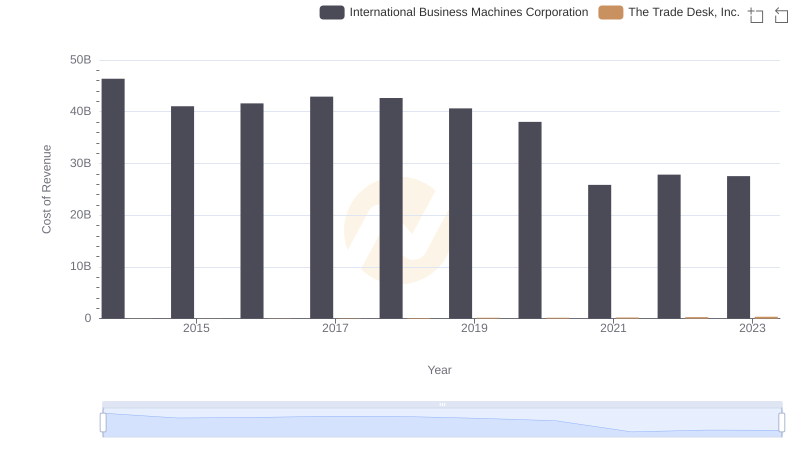
Cost Insights: Breaking Down International Business Machines Corporation and The Trade Desk, Inc.'s Expenses
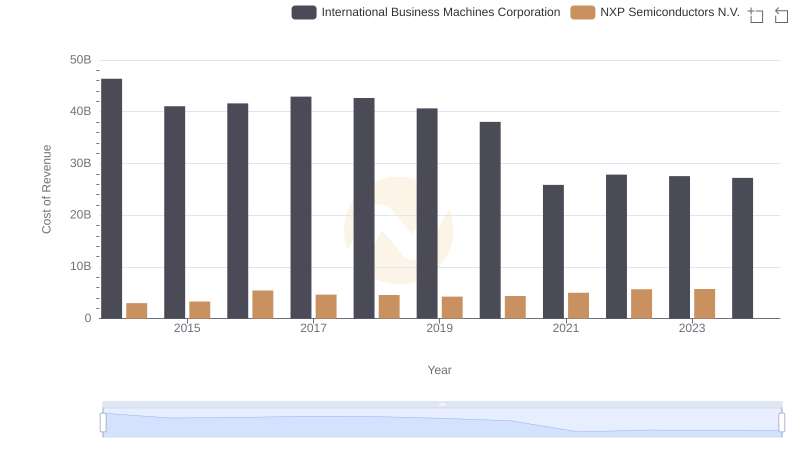
Cost of Revenue Comparison: International Business Machines Corporation vs NXP Semiconductors N.V.
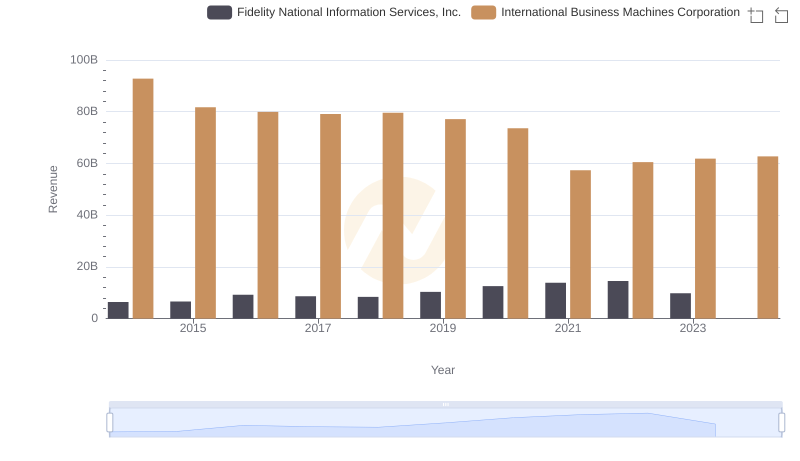
International Business Machines Corporation and Fidelity National Information Services, Inc.: A Comprehensive Revenue Analysis
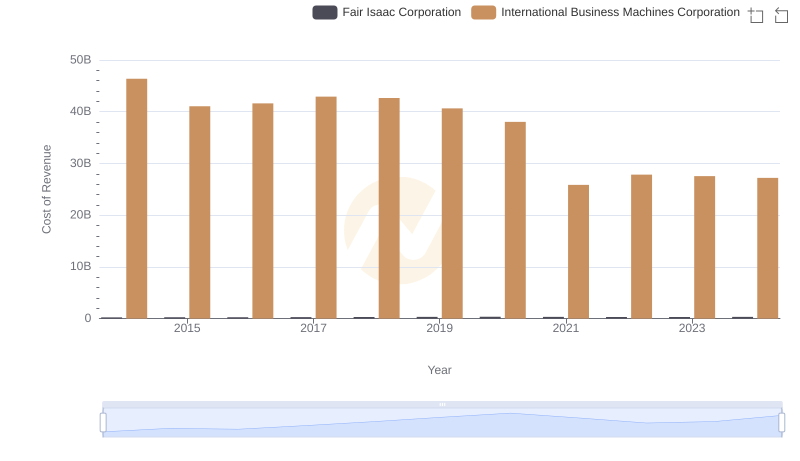
Cost of Revenue Trends: International Business Machines Corporation vs Fair Isaac Corporation
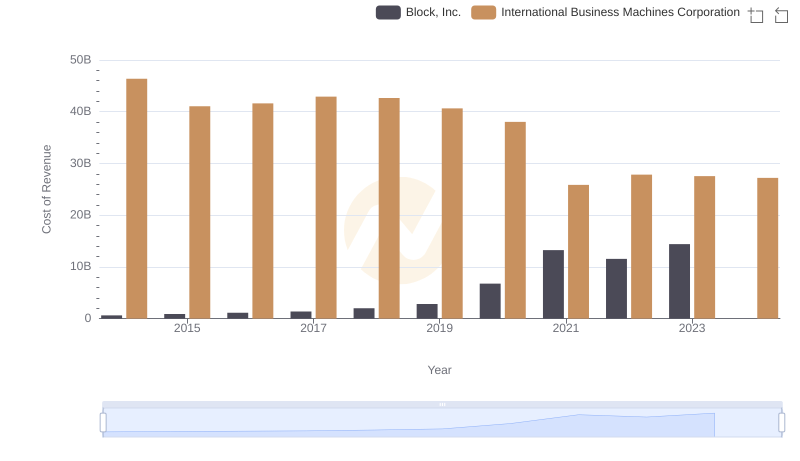
Cost Insights: Breaking Down International Business Machines Corporation and Block, Inc.'s Expenses
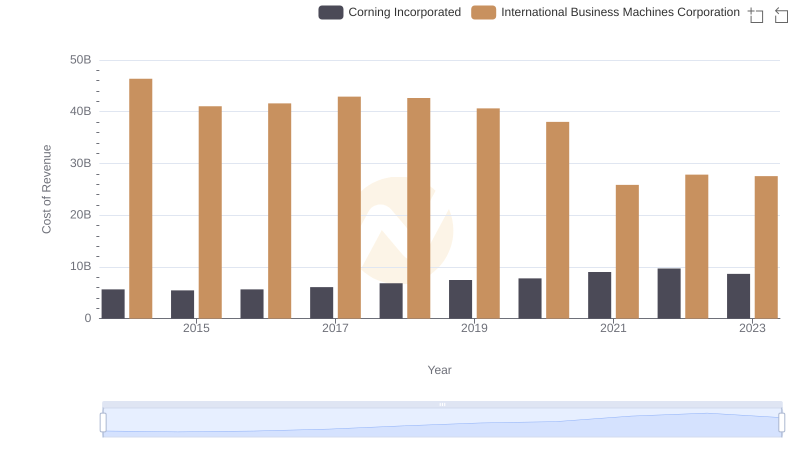
Cost of Revenue: Key Insights for International Business Machines Corporation and Corning Incorporated
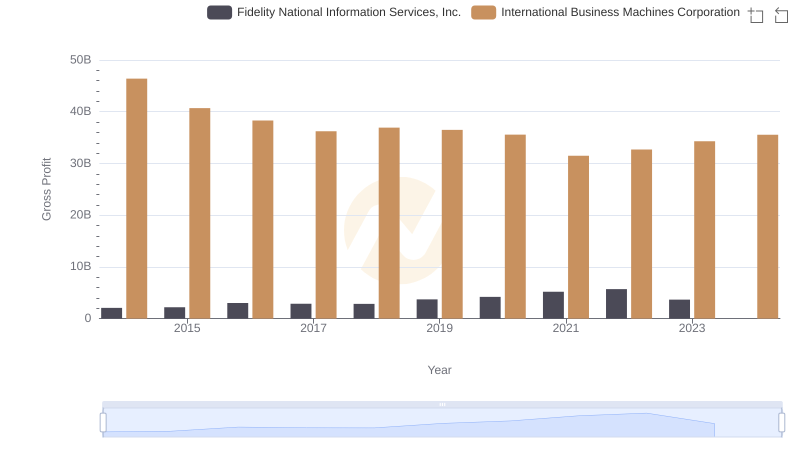
Who Generates Higher Gross Profit? International Business Machines Corporation or Fidelity National Information Services, Inc.
Cost Insights: Breaking Down International Business Machines Corporation and Gartner, Inc.'s Expenses
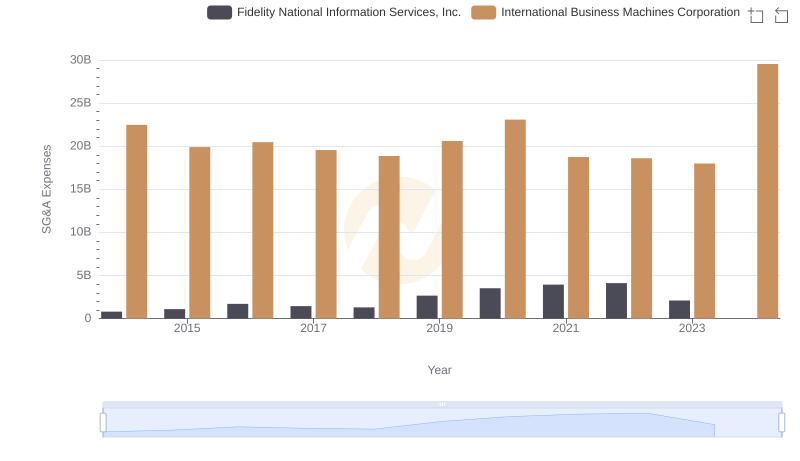
Comparing SG&A Expenses: International Business Machines Corporation vs Fidelity National Information Services, Inc. Trends and Insights

Cost of Revenue Comparison: International Business Machines Corporation vs Garmin Ltd.
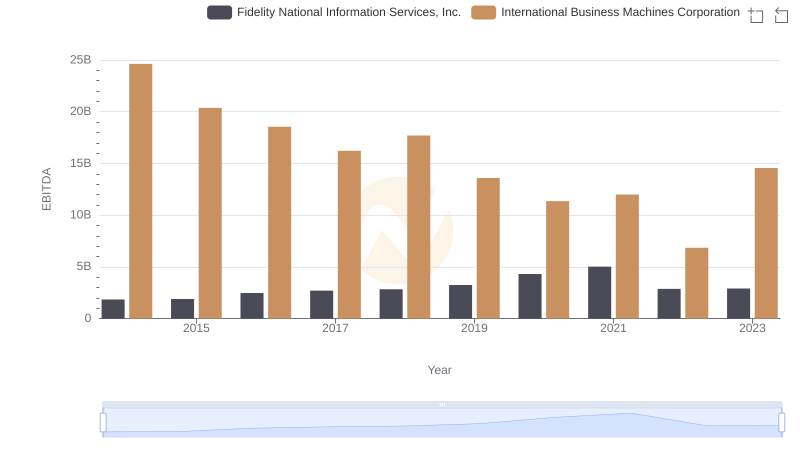
International Business Machines Corporation vs Fidelity National Information Services, Inc.: In-Depth EBITDA Performance Comparison