| __timestamp | International Business Machines Corporation | NXP Semiconductors N.V. |
|---|---|---|
| Wednesday, January 1, 2014 | 46386000000 | 3007000000 |
| Thursday, January 1, 2015 | 41057000000 | 3314000000 |
| Friday, January 1, 2016 | 41403000000 | 5429000000 |
| Sunday, January 1, 2017 | 42196000000 | 4637000000 |
| Monday, January 1, 2018 | 42655000000 | 4556000000 |
| Tuesday, January 1, 2019 | 26181000000 | 4259000000 |
| Wednesday, January 1, 2020 | 24314000000 | 4377000000 |
| Friday, January 1, 2021 | 25865000000 | 4996000000 |
| Saturday, January 1, 2022 | 27842000000 | 5688000000 |
| Sunday, January 1, 2023 | 27560000000 | 5723000000 |
| Monday, January 1, 2024 | 27202000000 |
In pursuit of knowledge
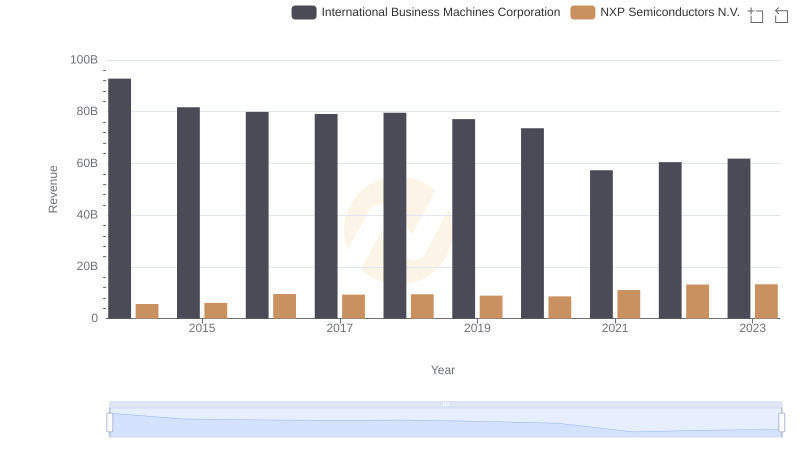
In the ever-evolving landscape of technology, the cost of revenue is a critical metric that reflects a company's operational efficiency. This comparison between International Business Machines Corporation (IBM) and NXP Semiconductors N.V. offers a fascinating glimpse into their financial journeys from 2014 to 2023.
IBM, a stalwart in the tech industry, has seen its cost of revenue fluctuate over the years. Starting at a peak in 2014, IBM's cost of revenue has decreased by approximately 41% by 2023. This decline suggests a strategic shift towards more efficient operations or a change in business focus.
In contrast, NXP Semiconductors has experienced a steady increase in its cost of revenue, growing by nearly 90% over the same period. This growth reflects NXP's expanding market presence and investment in innovation.
It's worth noting that data for 2024 is incomplete, highlighting the dynamic nature of financial reporting.
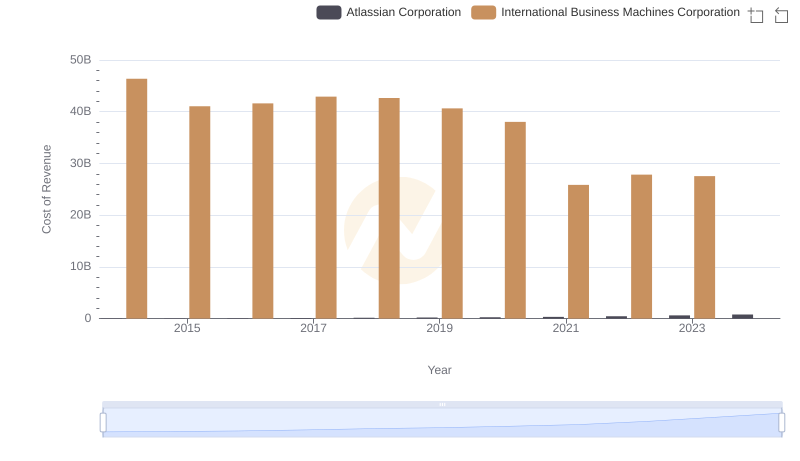
Cost of Revenue: Key Insights for International Business Machines Corporation and Atlassian Corporation
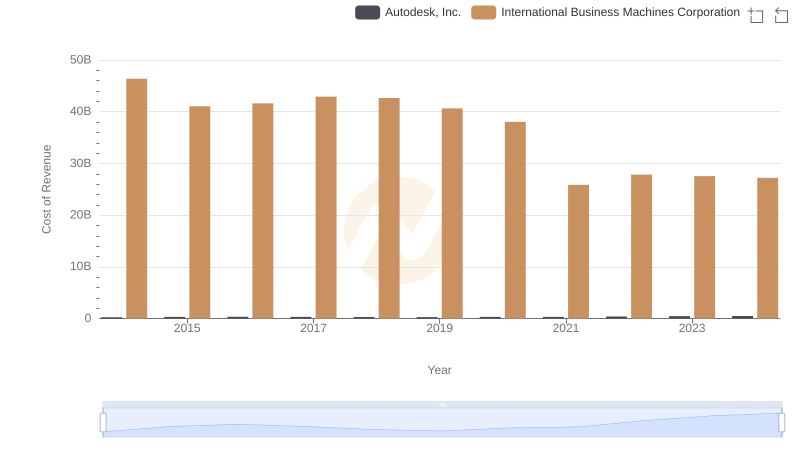
Cost of Revenue Trends: International Business Machines Corporation vs Autodesk, Inc.
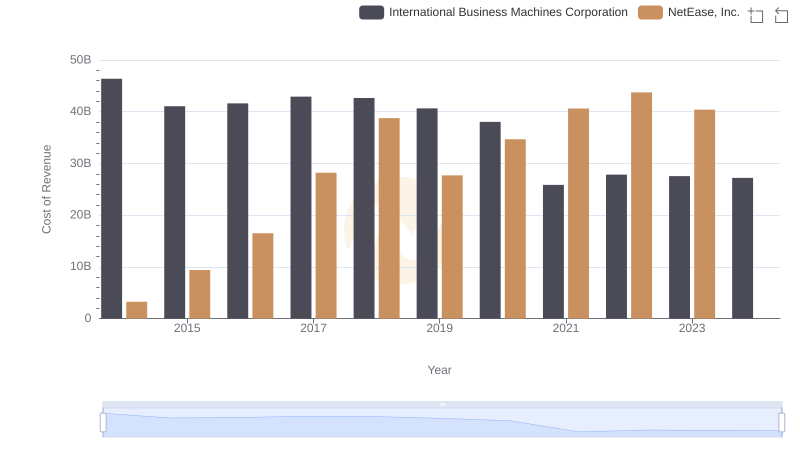
Cost of Revenue: Key Insights for International Business Machines Corporation and NetEase, Inc.
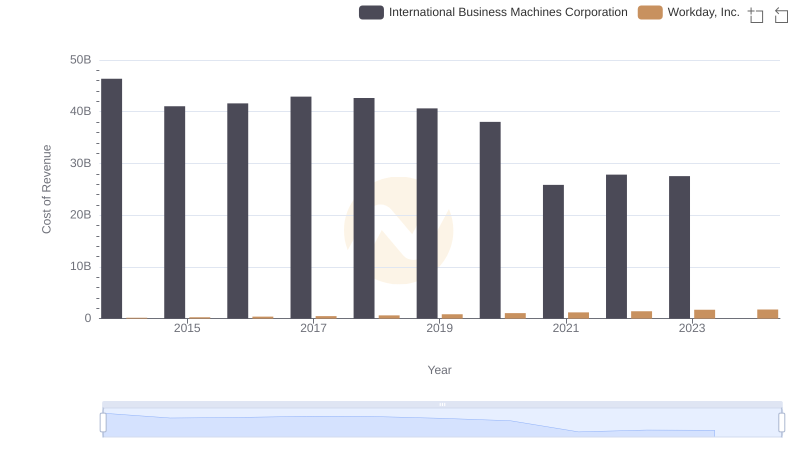
Cost of Revenue Comparison: International Business Machines Corporation vs Workday, Inc.
Comparing Revenue Performance: International Business Machines Corporation or NXP Semiconductors N.V.?
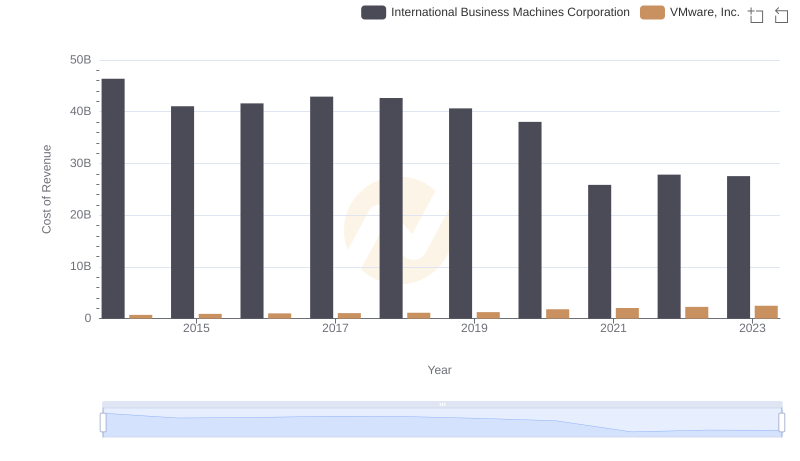
Cost of Revenue Trends: International Business Machines Corporation vs VMware, Inc.
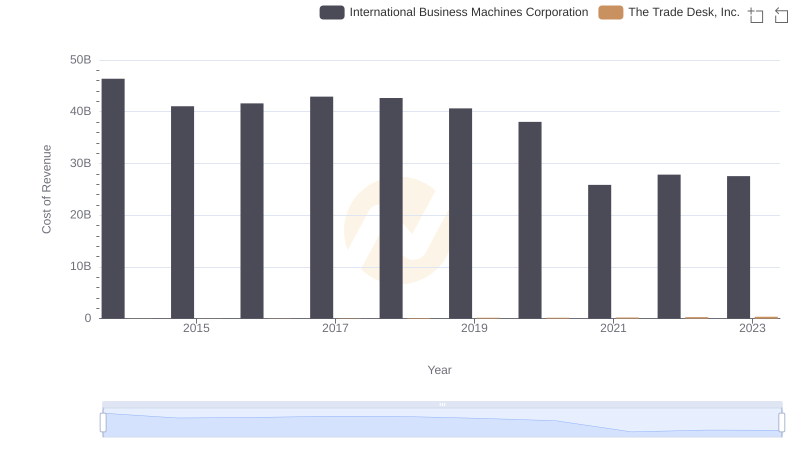
Cost Insights: Breaking Down International Business Machines Corporation and The Trade Desk, Inc.'s Expenses
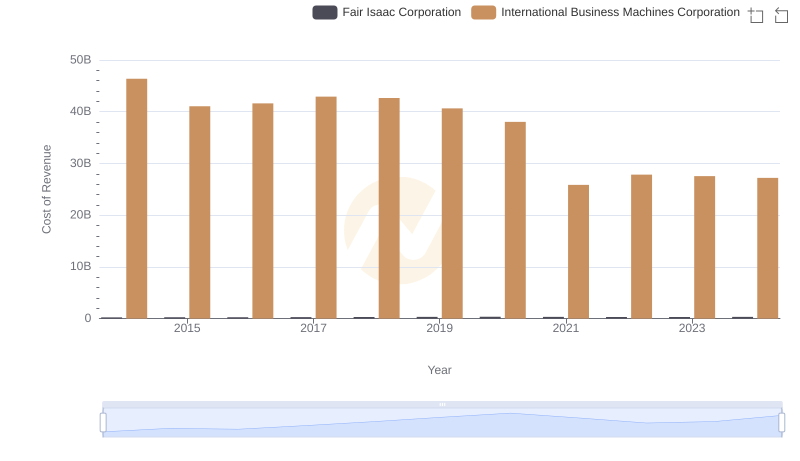
Cost of Revenue Trends: International Business Machines Corporation vs Fair Isaac Corporation
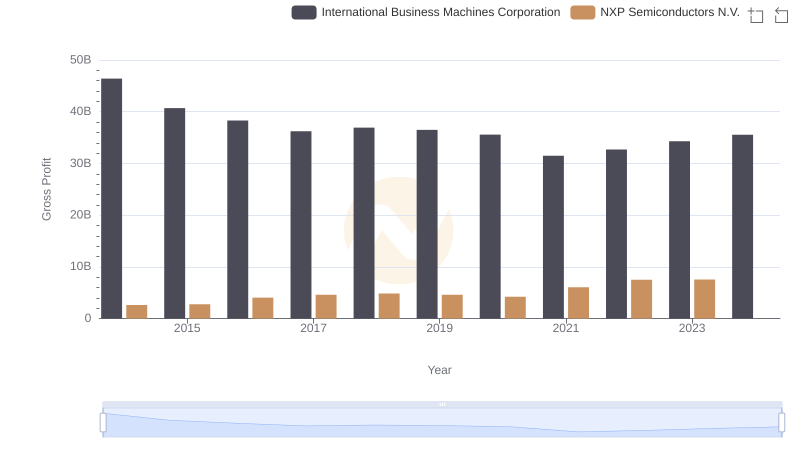
Gross Profit Comparison: International Business Machines Corporation and NXP Semiconductors N.V. Trends

R&D Insights: How International Business Machines Corporation and NXP Semiconductors N.V. Allocate Funds
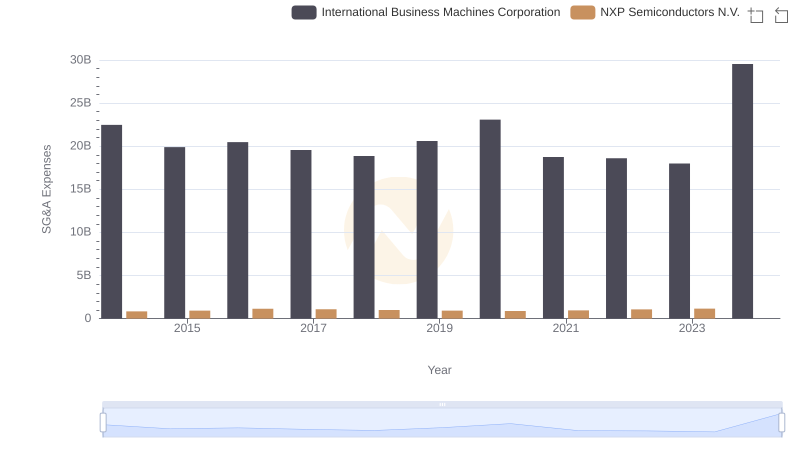
Selling, General, and Administrative Costs: International Business Machines Corporation vs NXP Semiconductors N.V.
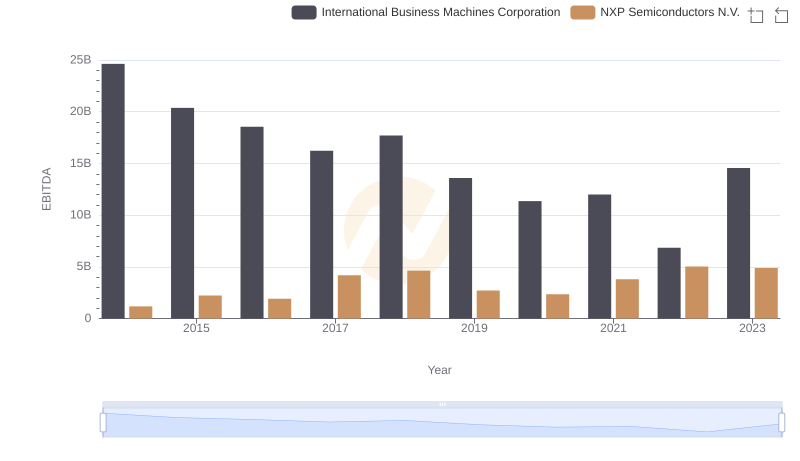
International Business Machines Corporation and NXP Semiconductors N.V.: A Detailed Examination of EBITDA Performance