| __timestamp | Block, Inc. | International Business Machines Corporation |
|---|---|---|
| Wednesday, January 1, 2014 | 624118000 | 46386000000 |
| Thursday, January 1, 2015 | 897088000 | 41057000000 |
| Friday, January 1, 2016 | 1132683000 | 41403000000 |
| Sunday, January 1, 2017 | 1374947000 | 42196000000 |
| Monday, January 1, 2018 | 1994477000 | 42655000000 |
| Tuesday, January 1, 2019 | 2823815000 | 26181000000 |
| Wednesday, January 1, 2020 | 6764169000 | 24314000000 |
| Friday, January 1, 2021 | 13241380000 | 25865000000 |
| Saturday, January 1, 2022 | 11539695000 | 27842000000 |
| Sunday, January 1, 2023 | 14410737000 | 27560000000 |
| Monday, January 1, 2024 | 27202000000 |
Unleashing the power of data
In the ever-evolving landscape of technology and finance, understanding the cost dynamics of industry giants like International Business Machines Corporation (IBM) and Block, Inc. (formerly Square) is crucial. Over the past decade, IBM's cost of revenue has shown a steady decline, dropping from approximately $46 billion in 2014 to around $27 billion in 2023. This represents a significant reduction of nearly 41%, reflecting IBM's strategic shift towards more efficient operations and cloud-based solutions.
Conversely, Block, Inc. has experienced a dramatic increase in its cost of revenue, skyrocketing from $624 million in 2014 to $14 billion in 2023. This 22-fold increase underscores Block's aggressive expansion and diversification in the fintech space. Notably, the data for 2024 is incomplete, highlighting the dynamic nature of these industries. As these companies continue to adapt, their cost structures will remain a key indicator of their strategic directions.
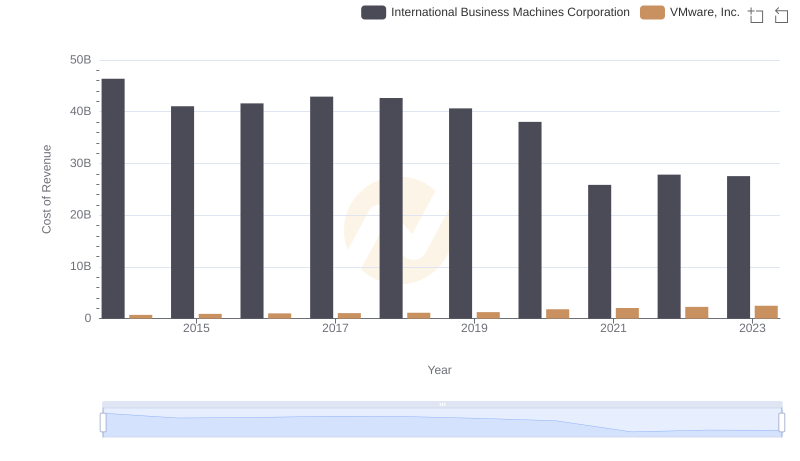
Cost of Revenue Trends: International Business Machines Corporation vs VMware, Inc.
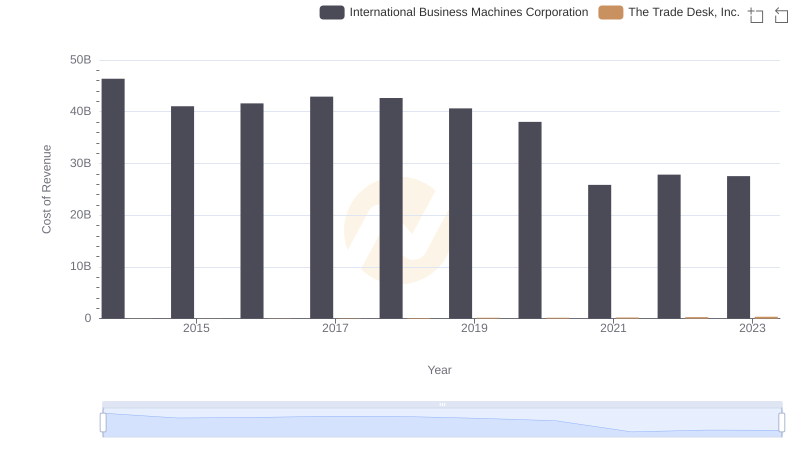
Cost Insights: Breaking Down International Business Machines Corporation and The Trade Desk, Inc.'s Expenses
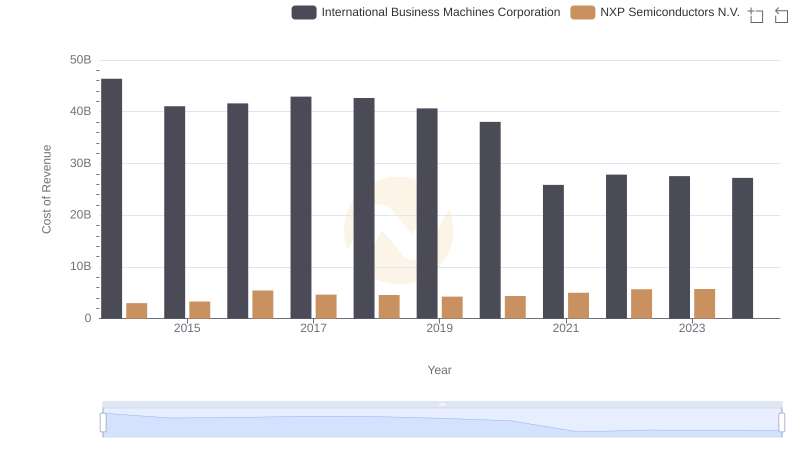
Cost of Revenue Comparison: International Business Machines Corporation vs NXP Semiconductors N.V.
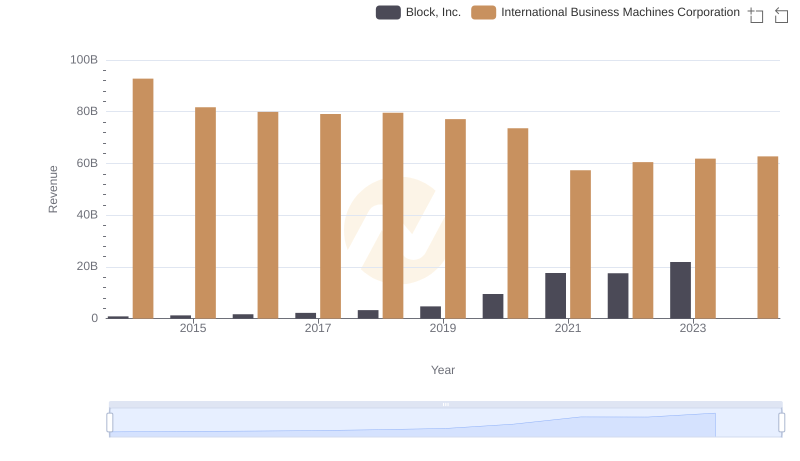
Who Generates More Revenue? International Business Machines Corporation or Block, Inc.
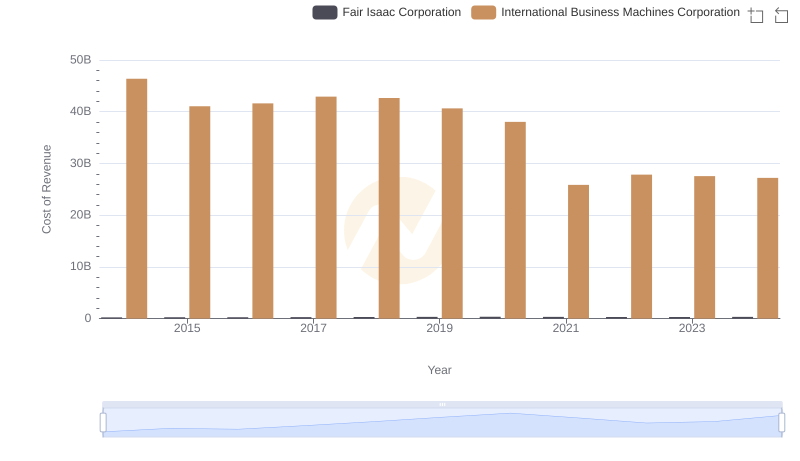
Cost of Revenue Trends: International Business Machines Corporation vs Fair Isaac Corporation
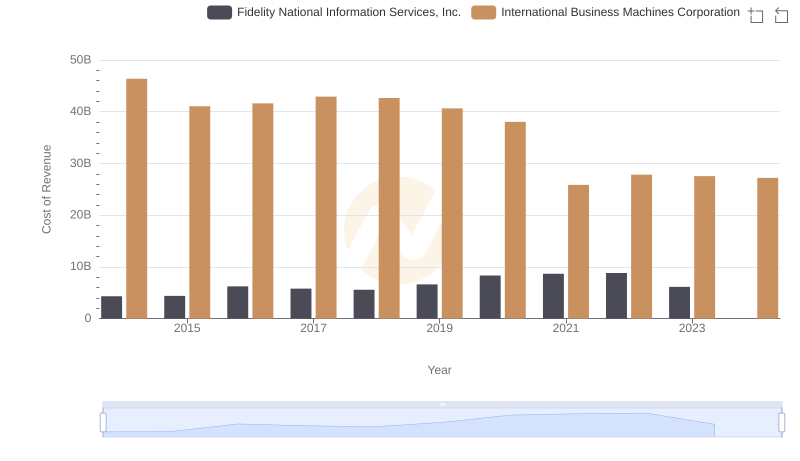
Analyzing Cost of Revenue: International Business Machines Corporation and Fidelity National Information Services, Inc.
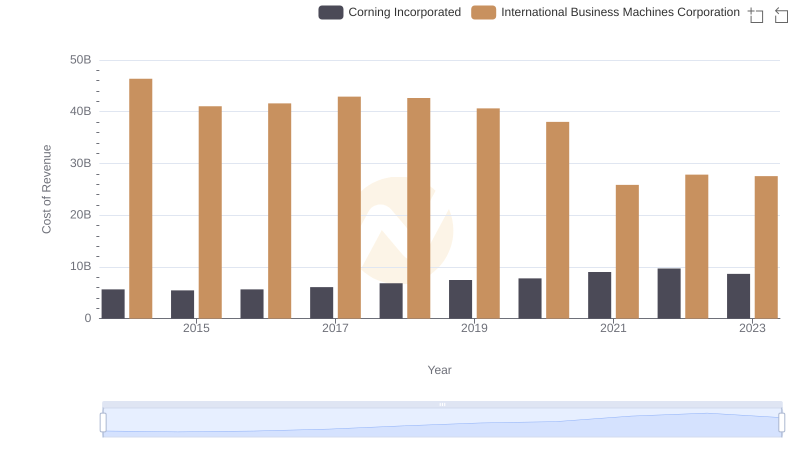
Cost of Revenue: Key Insights for International Business Machines Corporation and Corning Incorporated
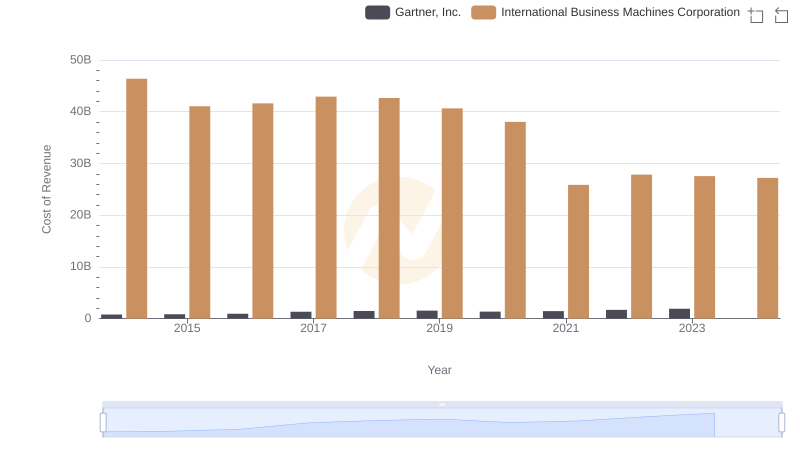
Cost Insights: Breaking Down International Business Machines Corporation and Gartner, Inc.'s Expenses
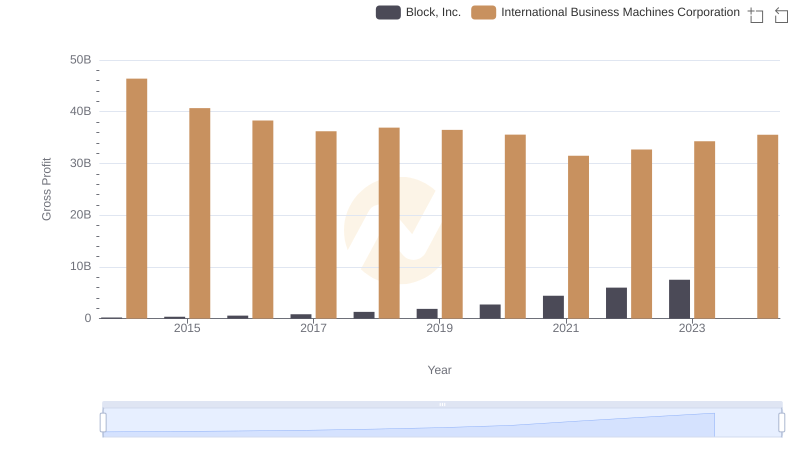
Who Generates Higher Gross Profit? International Business Machines Corporation or Block, Inc.

Cost of Revenue Comparison: International Business Machines Corporation vs Garmin Ltd.
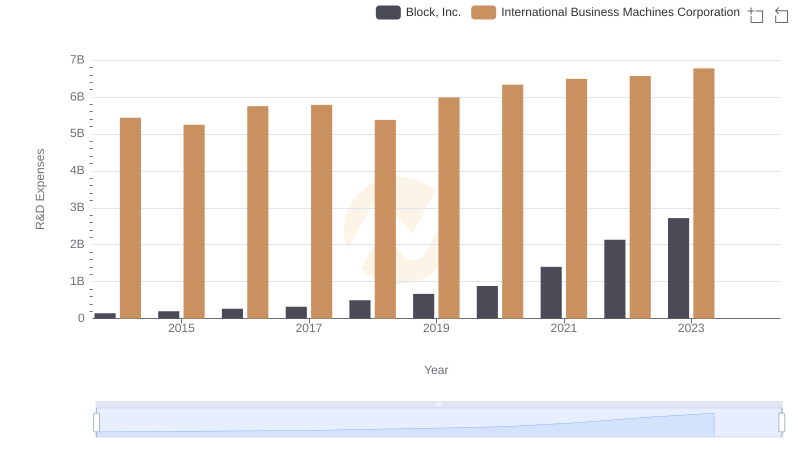
International Business Machines Corporation vs Block, Inc.: Strategic Focus on R&D Spending
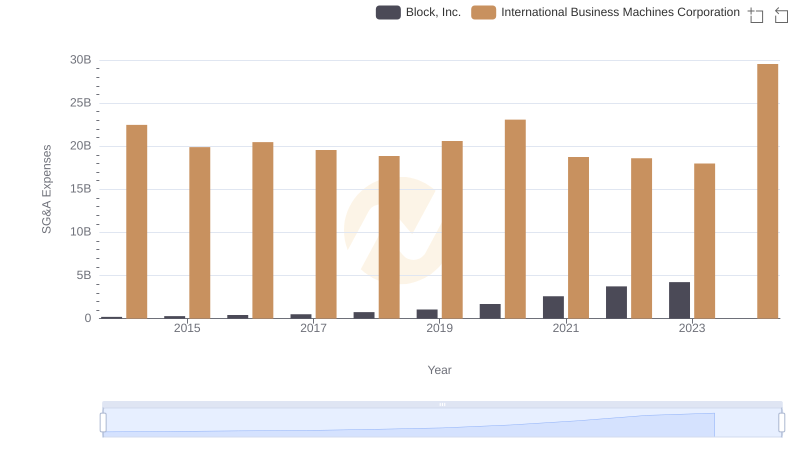
International Business Machines Corporation vs Block, Inc.: SG&A Expense Trends