| __timestamp | Fidelity National Information Services, Inc. | International Business Machines Corporation |
|---|---|---|
| Wednesday, January 1, 2014 | 1846200000 | 24962000000 |
| Thursday, January 1, 2015 | 1901000000 | 20268000000 |
| Friday, January 1, 2016 | 2474000000 | 17341000000 |
| Sunday, January 1, 2017 | 2700000000 | 16556000000 |
| Monday, January 1, 2018 | 2837000000 | 16545000000 |
| Tuesday, January 1, 2019 | 3244000000 | 14609000000 |
| Wednesday, January 1, 2020 | 4319000000 | 10555000000 |
| Friday, January 1, 2021 | 5021000000 | 12409000000 |
| Saturday, January 1, 2022 | 2875000000 | 7174000000 |
| Sunday, January 1, 2023 | 2906000000 | 14693000000 |
| Monday, January 1, 2024 | 1709000000 | 6015000000 |
Igniting the spark of knowledge
In the ever-evolving landscape of technology and financial services, International Business Machines Corporation (IBM) and Fidelity National Information Services, Inc. (FIS) have been pivotal players. From 2014 to 2023, these industry titans have showcased contrasting EBITDA trajectories. IBM, a stalwart in the tech industry, saw its EBITDA peak in 2014, only to experience a gradual decline, reaching a low in 2022. However, a resurgence in 2023 marked a 112% increase from the previous year, highlighting its resilience.
Conversely, FIS demonstrated a steady climb, with a notable 172% growth from 2014 to 2021, before a dip in 2022. Despite this, FIS maintained a robust performance, with its EBITDA in 2023 still 57% higher than in 2014. This comparison underscores the dynamic nature of these sectors and the strategic maneuvers companies must employ to stay competitive.
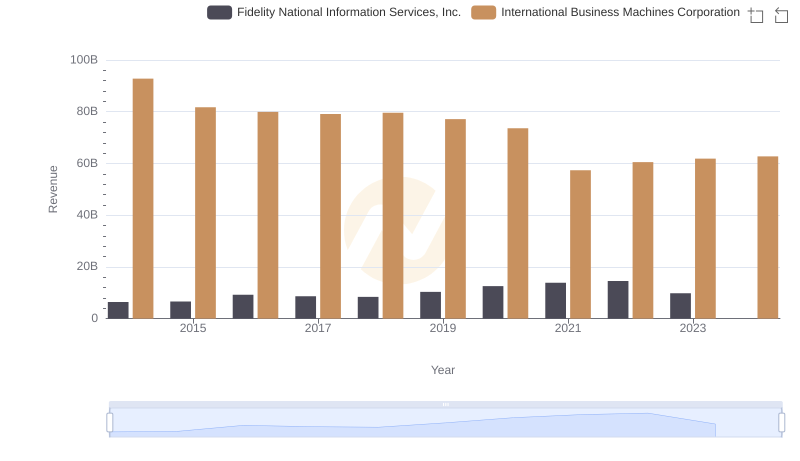
International Business Machines Corporation and Fidelity National Information Services, Inc.: A Comprehensive Revenue Analysis
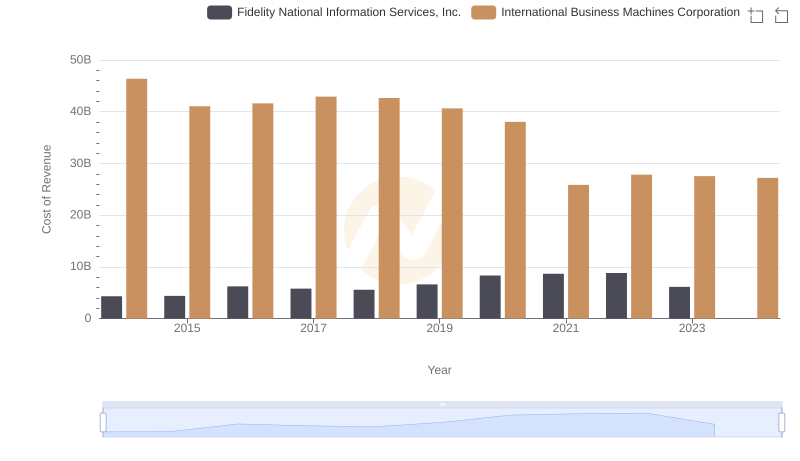
Analyzing Cost of Revenue: International Business Machines Corporation and Fidelity National Information Services, Inc.
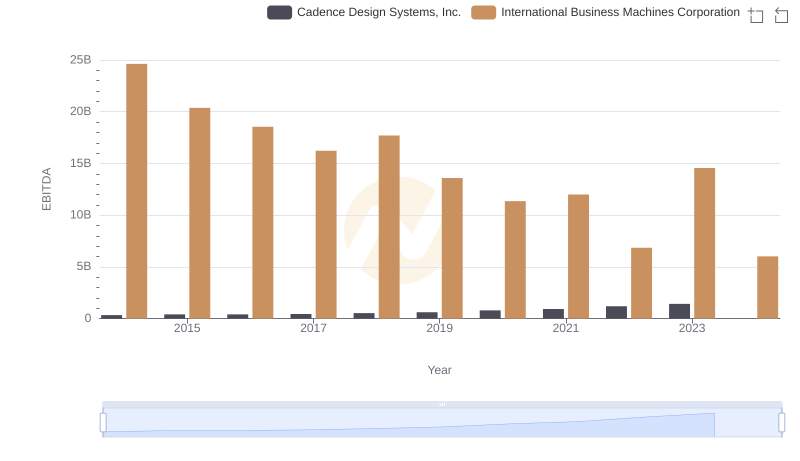
EBITDA Analysis: Evaluating International Business Machines Corporation Against Cadence Design Systems, Inc.
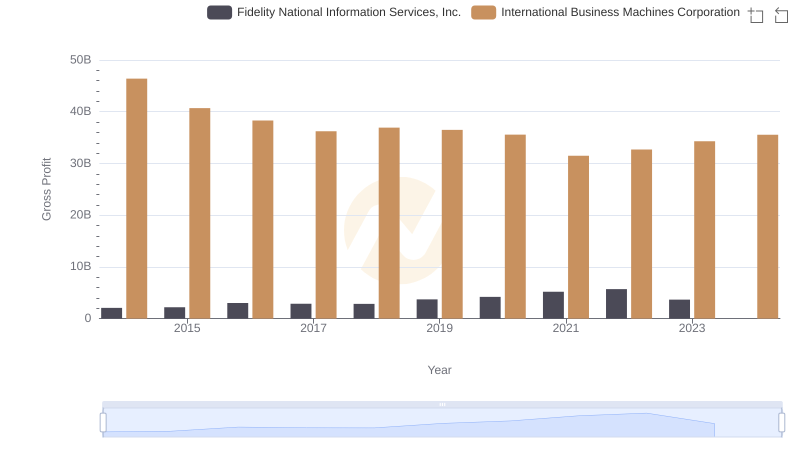
Who Generates Higher Gross Profit? International Business Machines Corporation or Fidelity National Information Services, Inc.
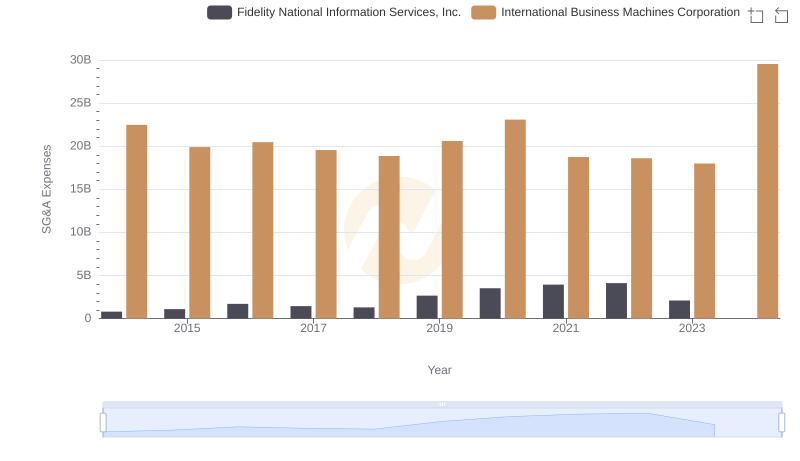
Comparing SG&A Expenses: International Business Machines Corporation vs Fidelity National Information Services, Inc. Trends and Insights
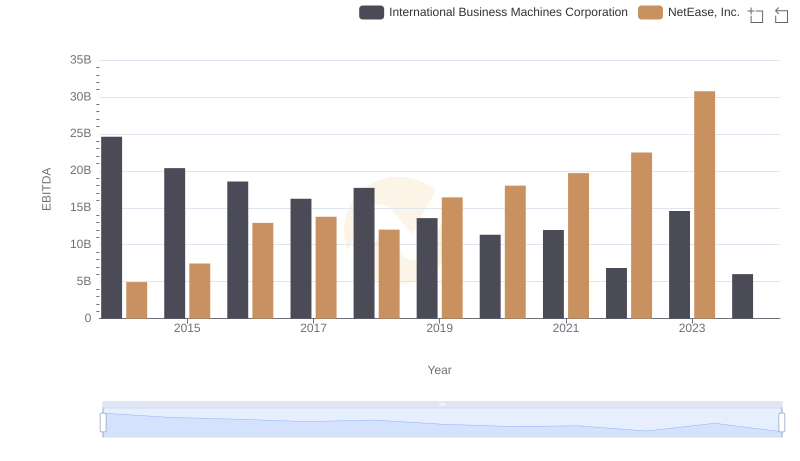
A Professional Review of EBITDA: International Business Machines Corporation Compared to NetEase, Inc.
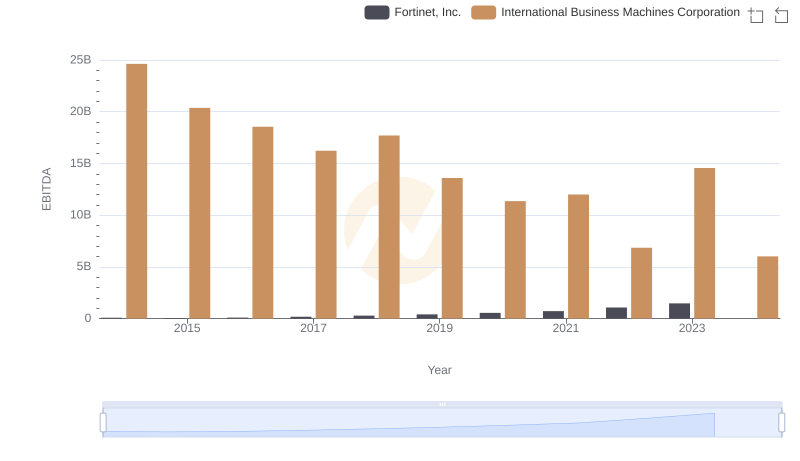
A Side-by-Side Analysis of EBITDA: International Business Machines Corporation and Fortinet, Inc.

International Business Machines Corporation and VMware, Inc.: A Detailed Examination of EBITDA Performance
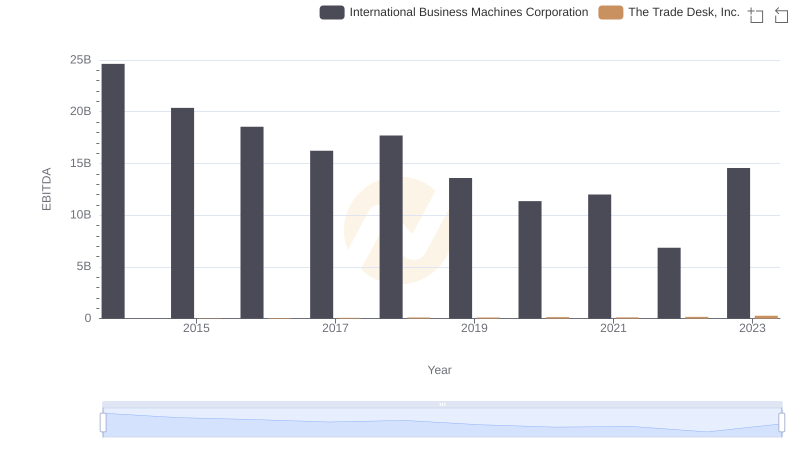
A Professional Review of EBITDA: International Business Machines Corporation Compared to The Trade Desk, Inc.
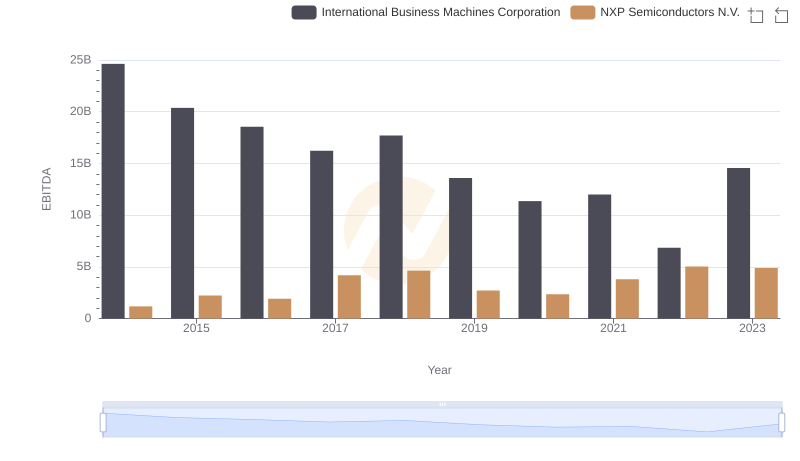
International Business Machines Corporation and NXP Semiconductors N.V.: A Detailed Examination of EBITDA Performance
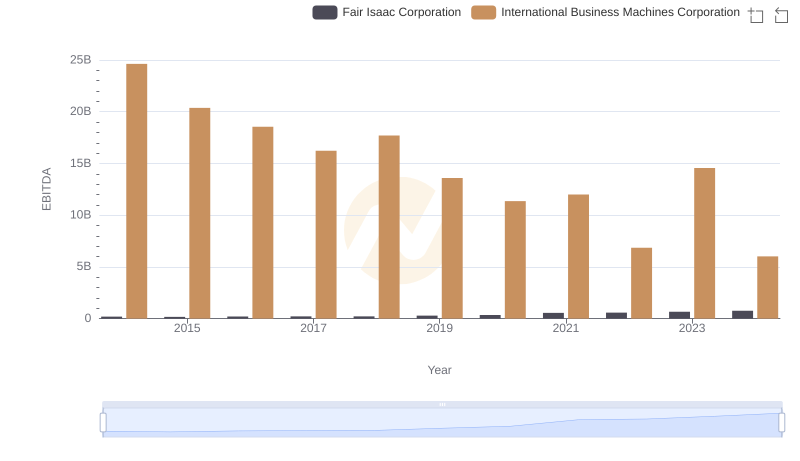
EBITDA Metrics Evaluated: International Business Machines Corporation vs Fair Isaac Corporation

International Business Machines Corporation vs Gartner, Inc.: In-Depth EBITDA Performance Comparison