| __timestamp | Garmin Ltd. | International Business Machines Corporation |
|---|---|---|
| Wednesday, January 1, 2014 | 1266246000 | 46386000000 |
| Thursday, January 1, 2015 | 1281566000 | 41057000000 |
| Friday, January 1, 2016 | 1339095000 | 41403000000 |
| Sunday, January 1, 2017 | 1303840000 | 42196000000 |
| Monday, January 1, 2018 | 1367725000 | 42655000000 |
| Tuesday, January 1, 2019 | 1523529000 | 26181000000 |
| Wednesday, January 1, 2020 | 1705237000 | 24314000000 |
| Friday, January 1, 2021 | 2092336000 | 25865000000 |
| Saturday, January 1, 2022 | 2053511000 | 27842000000 |
| Sunday, January 1, 2023 | 2223297000 | 27560000000 |
| Monday, January 1, 2024 | 2600348000 | 27202000000 |
Data in motion
In the ever-evolving landscape of technology, the cost of revenue is a critical metric that reflects a company's operational efficiency. From 2014 to 2023, International Business Machines Corporation (IBM) and Garmin Ltd. have showcased contrasting trajectories in this regard. IBM, a stalwart in the tech industry, saw its cost of revenue decrease by approximately 41%, from 46.4 billion in 2014 to 27.6 billion in 2023. This decline highlights IBM's strategic shift towards more efficient operations. Conversely, Garmin Ltd., known for its innovative GPS technology, experienced a 76% increase in its cost of revenue, rising from 1.3 billion in 2014 to 2.2 billion in 2023. This growth underscores Garmin's expanding market presence and investment in new technologies. Notably, data for 2024 is incomplete, leaving room for speculation on future trends.
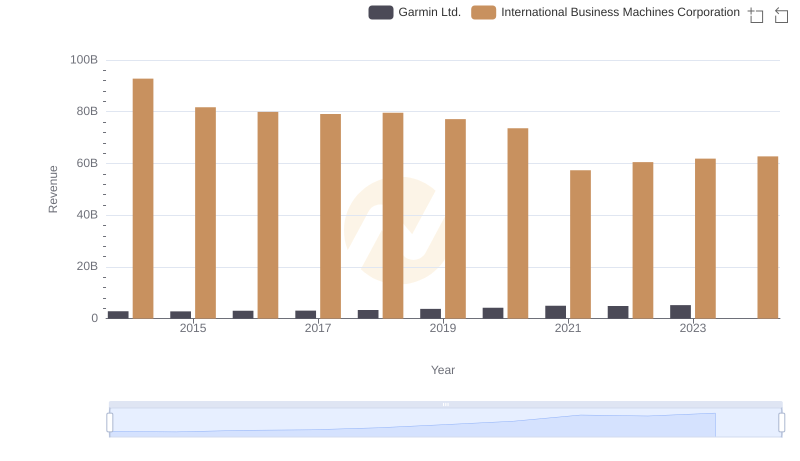
International Business Machines Corporation vs Garmin Ltd.: Examining Key Revenue Metrics
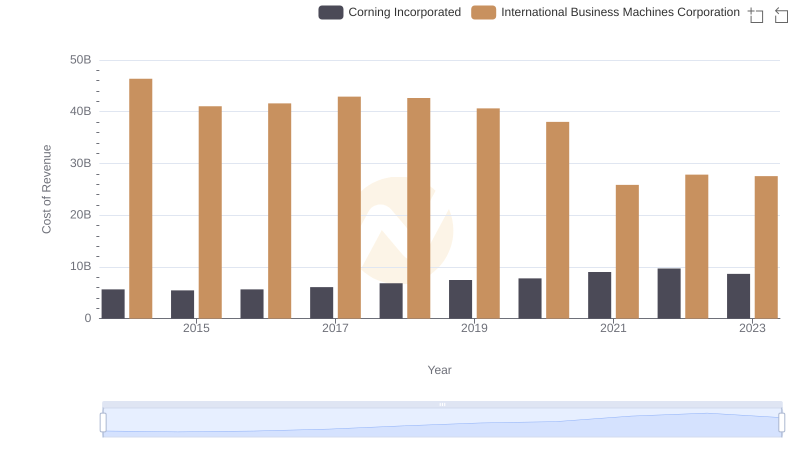
Cost of Revenue: Key Insights for International Business Machines Corporation and Corning Incorporated
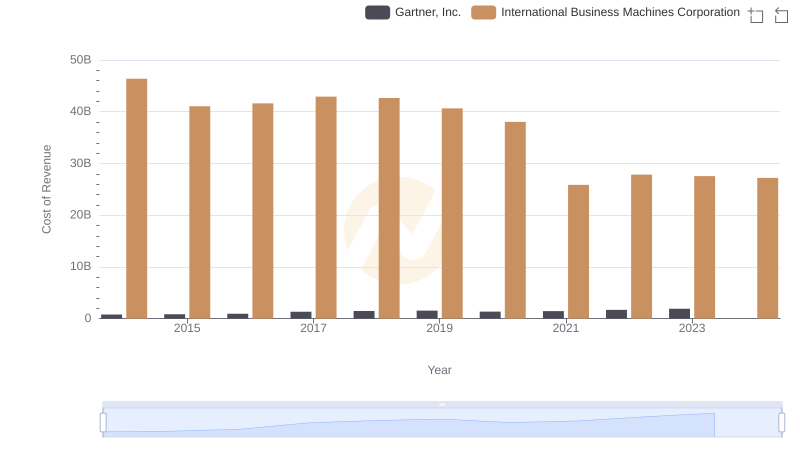
Cost Insights: Breaking Down International Business Machines Corporation and Gartner, Inc.'s Expenses
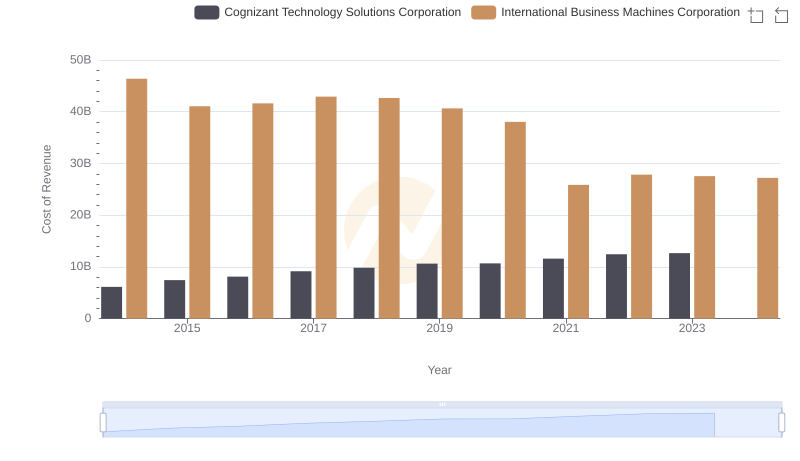
Analyzing Cost of Revenue: International Business Machines Corporation and Cognizant Technology Solutions Corporation
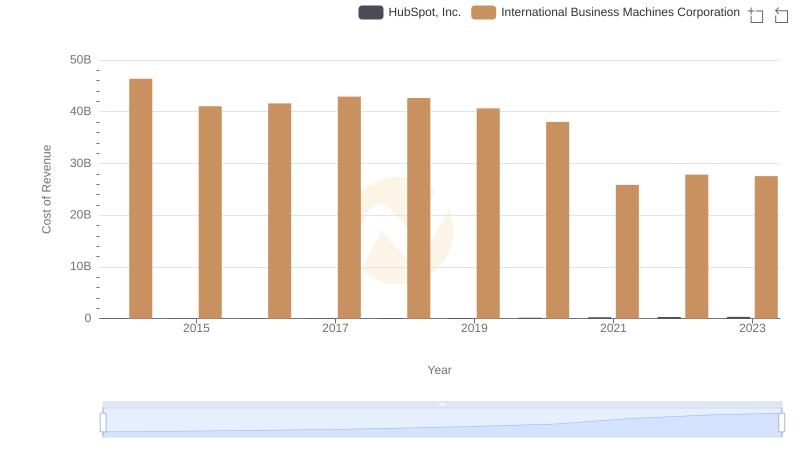
Cost of Revenue Trends: International Business Machines Corporation vs HubSpot, Inc.
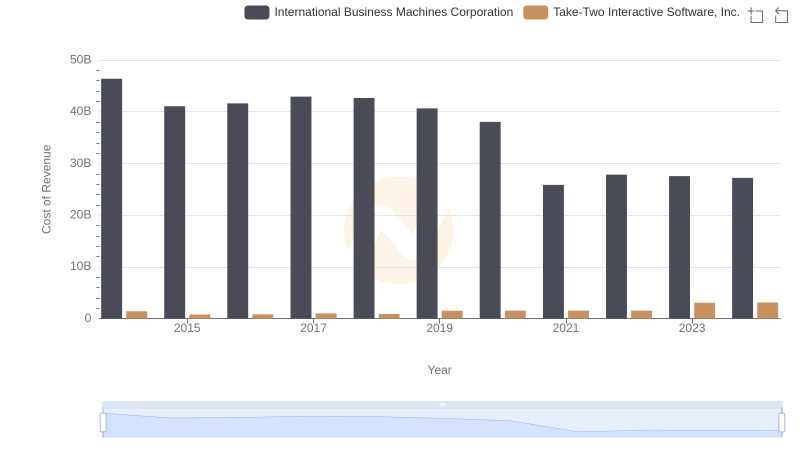
Cost of Revenue: Key Insights for International Business Machines Corporation and Take-Two Interactive Software, Inc.
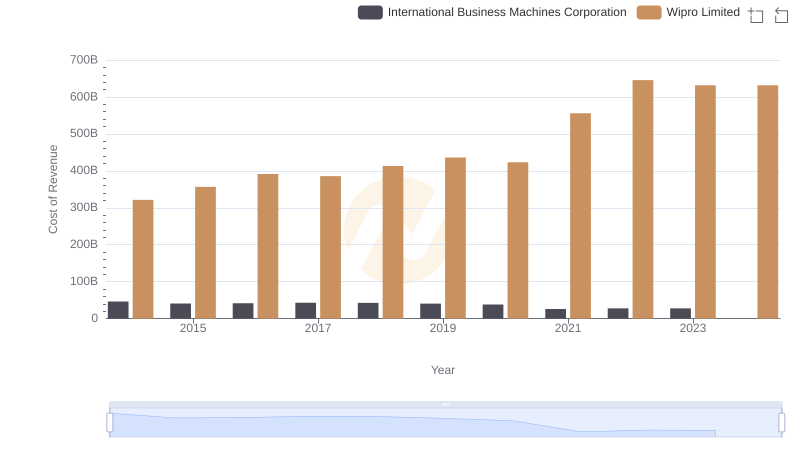
Analyzing Cost of Revenue: International Business Machines Corporation and Wipro Limited
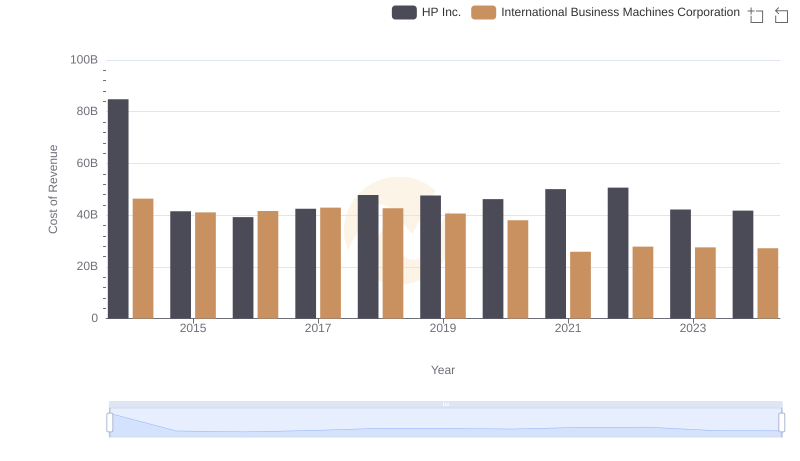
Cost of Revenue: Key Insights for International Business Machines Corporation and HP Inc.
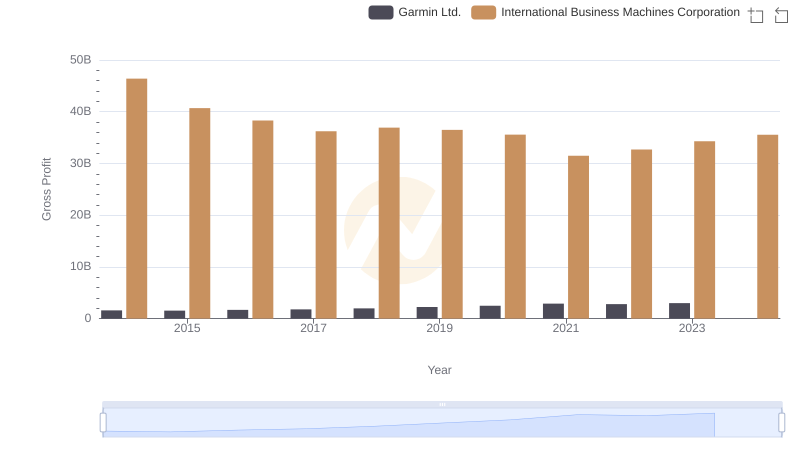
Gross Profit Trends Compared: International Business Machines Corporation vs Garmin Ltd.
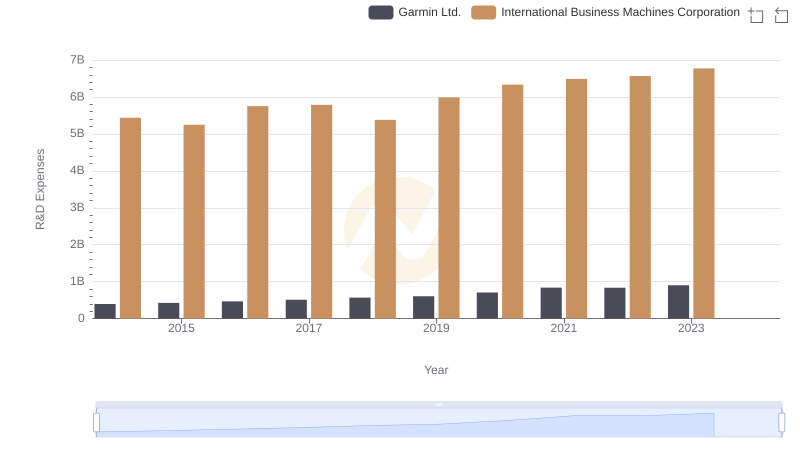
R&D Spending Showdown: International Business Machines Corporation vs Garmin Ltd.
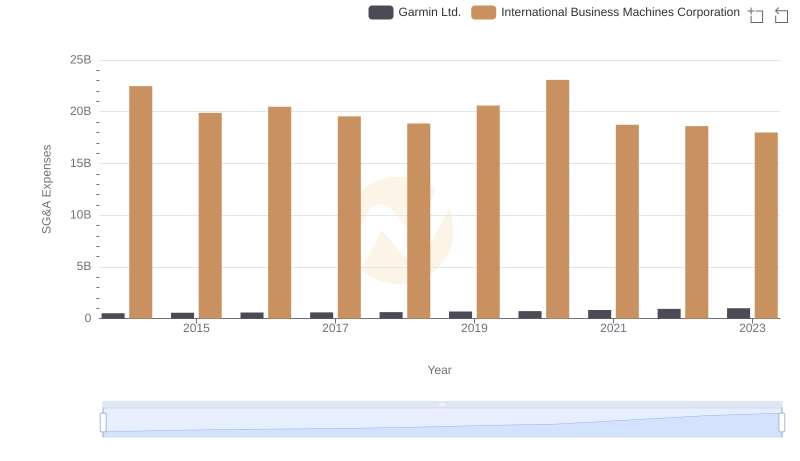
Operational Costs Compared: SG&A Analysis of International Business Machines Corporation and Garmin Ltd.
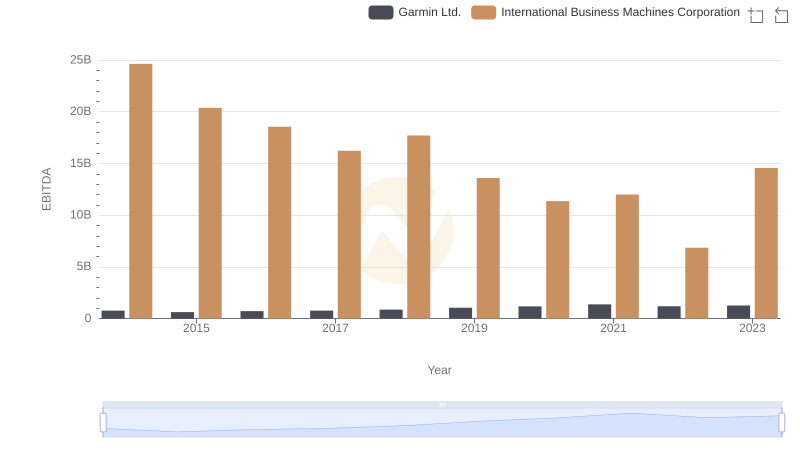
EBITDA Metrics Evaluated: International Business Machines Corporation vs Garmin Ltd.