| __timestamp | International Business Machines Corporation | The Trade Desk, Inc. |
|---|---|---|
| Wednesday, January 1, 2014 | 46386000000 | 12559000 |
| Thursday, January 1, 2015 | 41057000000 | 22967000 |
| Friday, January 1, 2016 | 41403000000 | 39876000 |
| Sunday, January 1, 2017 | 42196000000 | 66230000 |
| Monday, January 1, 2018 | 42655000000 | 114098000 |
| Tuesday, January 1, 2019 | 26181000000 | 156180000 |
| Wednesday, January 1, 2020 | 24314000000 | 178812000 |
| Friday, January 1, 2021 | 25865000000 | 221554000 |
| Saturday, January 1, 2022 | 27842000000 | 281123000 |
| Sunday, January 1, 2023 | 27560000000 | 365598000 |
| Monday, January 1, 2024 | 27202000000 | 472012000 |
Cracking the code
In the ever-evolving landscape of technology, understanding cost structures is crucial for investors and analysts alike. This article delves into the cost of revenue trends for two industry giants: International Business Machines Corporation (IBM) and The Trade Desk, Inc. Over the past decade, IBM's cost of revenue has seen a significant decline, dropping approximately 41% from 2014 to 2023. This reduction reflects IBM's strategic shift towards more efficient operations and a focus on high-margin services.
Conversely, The Trade Desk, a leader in digital advertising, has experienced a remarkable increase in its cost of revenue, growing nearly 29 times from 2014 to 2023. This surge underscores the company's rapid expansion and investment in cutting-edge technology. Notably, data for 2024 is incomplete, highlighting the dynamic nature of financial reporting. These insights offer a window into the strategic priorities and market positioning of these tech titans.
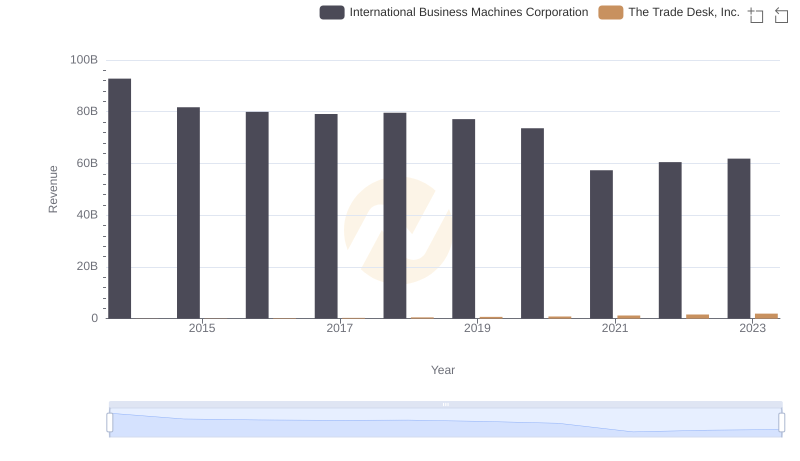
International Business Machines Corporation and The Trade Desk, Inc.: A Comprehensive Revenue Analysis
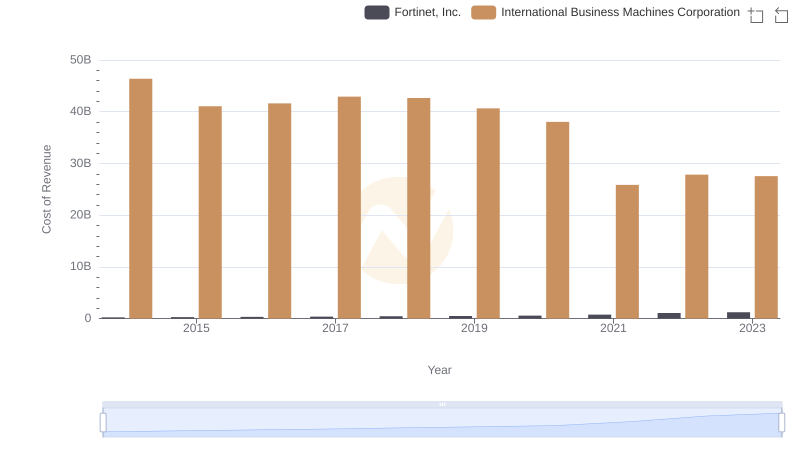
Cost Insights: Breaking Down International Business Machines Corporation and Fortinet, Inc.'s Expenses
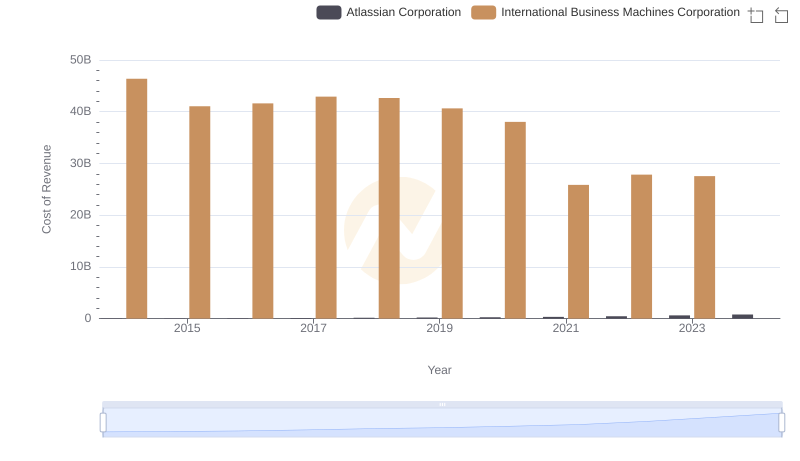
Cost of Revenue: Key Insights for International Business Machines Corporation and Atlassian Corporation
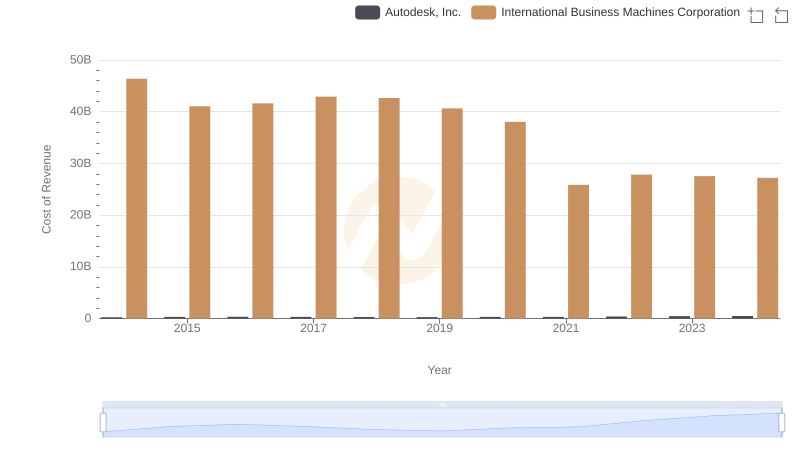
Cost of Revenue Trends: International Business Machines Corporation vs Autodesk, Inc.
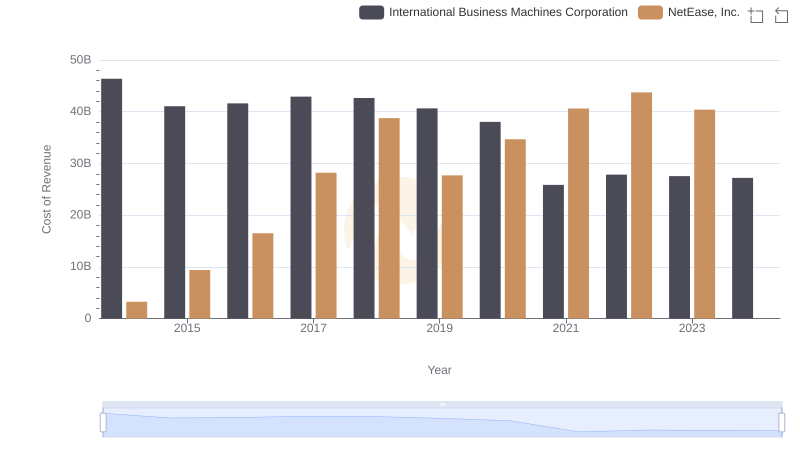
Cost of Revenue: Key Insights for International Business Machines Corporation and NetEase, Inc.
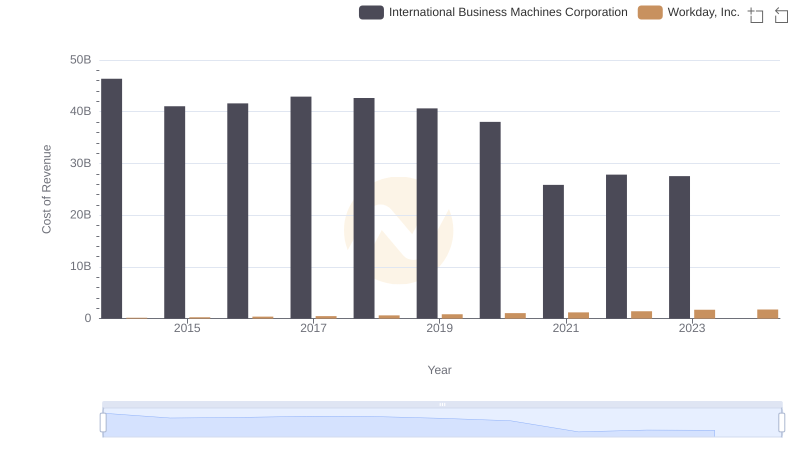
Cost of Revenue Comparison: International Business Machines Corporation vs Workday, Inc.
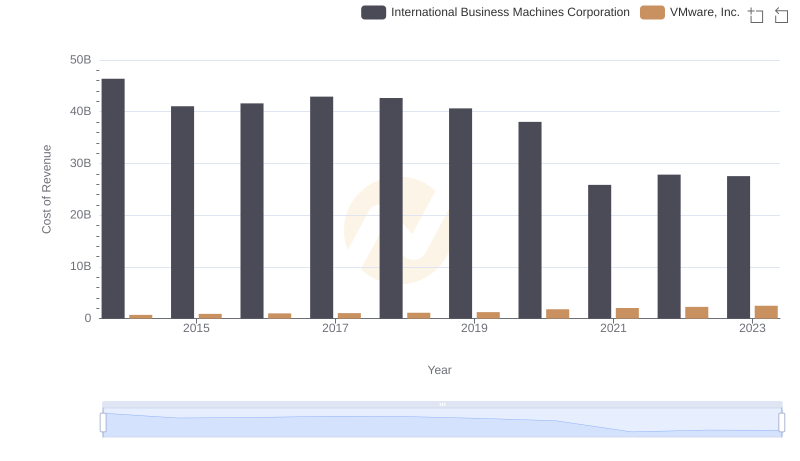
Cost of Revenue Trends: International Business Machines Corporation vs VMware, Inc.
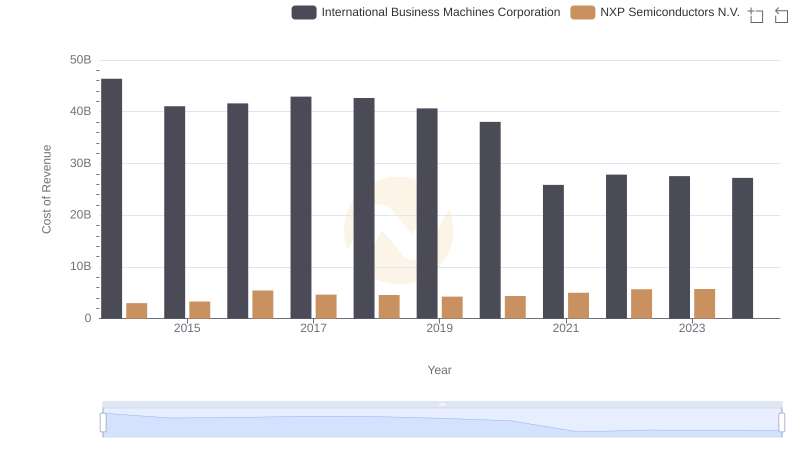
Cost of Revenue Comparison: International Business Machines Corporation vs NXP Semiconductors N.V.
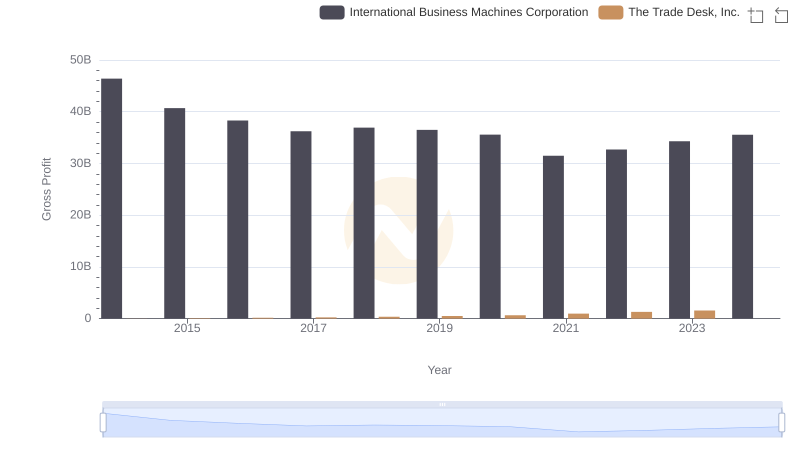
Key Insights on Gross Profit: International Business Machines Corporation vs The Trade Desk, Inc.

Comparing Innovation Spending: International Business Machines Corporation and The Trade Desk, Inc.
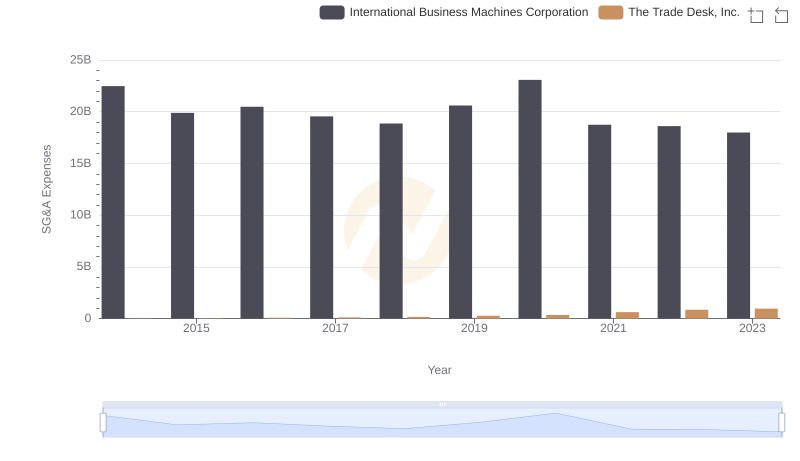
Operational Costs Compared: SG&A Analysis of International Business Machines Corporation and The Trade Desk, Inc.
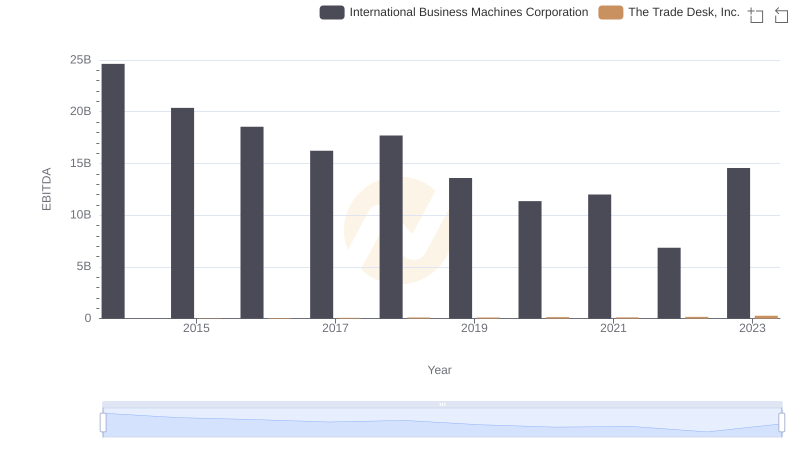
A Professional Review of EBITDA: International Business Machines Corporation Compared to The Trade Desk, Inc.