| __timestamp | Gartner, Inc. | International Business Machines Corporation |
|---|---|---|
| Wednesday, January 1, 2014 | 797933000 | 46386000000 |
| Thursday, January 1, 2015 | 839076000 | 41057000000 |
| Friday, January 1, 2016 | 945648000 | 41403000000 |
| Sunday, January 1, 2017 | 1320198000 | 42196000000 |
| Monday, January 1, 2018 | 1468800000 | 42655000000 |
| Tuesday, January 1, 2019 | 1550568000 | 26181000000 |
| Wednesday, January 1, 2020 | 1345096000 | 24314000000 |
| Friday, January 1, 2021 | 1444106000 | 25865000000 |
| Saturday, January 1, 2022 | 1693805000 | 27842000000 |
| Sunday, January 1, 2023 | 1903240000 | 27560000000 |
| Monday, January 1, 2024 | 0 | 27202000000 |
Data in motion
In the ever-evolving landscape of technology, understanding the cost dynamics of industry giants like International Business Machines Corporation (IBM) and Gartner, Inc. is crucial. Over the past decade, IBM's cost of revenue has seen a significant decline, dropping from approximately 46 trillion in 2014 to around 27 trillion in 2023. This represents a reduction of nearly 41%, reflecting IBM's strategic shifts and operational efficiencies.
Conversely, Gartner, Inc. has experienced a steady increase in its cost of revenue, growing by about 138% from 2014 to 2023. This rise underscores Gartner's expansion and investment in its services. Notably, the data for 2024 is incomplete, highlighting the dynamic nature of financial forecasting.
These trends offer a window into the financial strategies of these tech titans, providing valuable insights for investors and industry analysts alike.
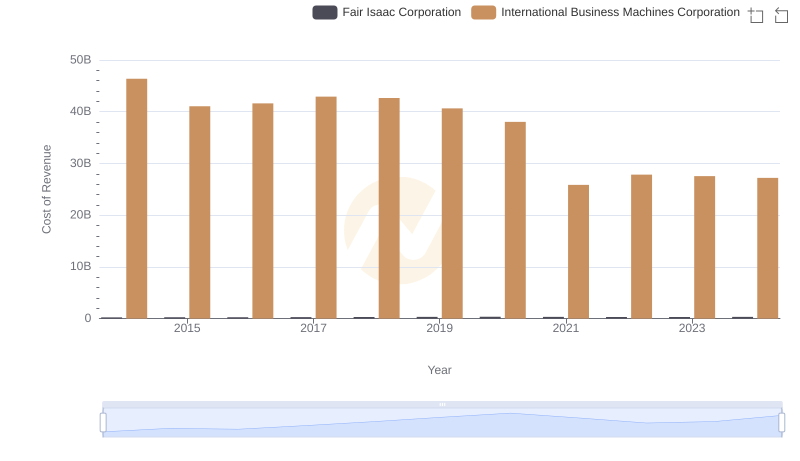
Cost of Revenue Trends: International Business Machines Corporation vs Fair Isaac Corporation
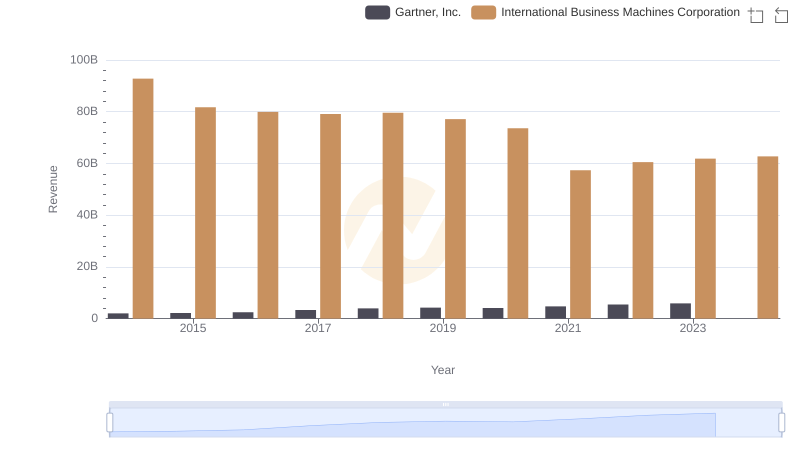
International Business Machines Corporation vs Gartner, Inc.: Examining Key Revenue Metrics
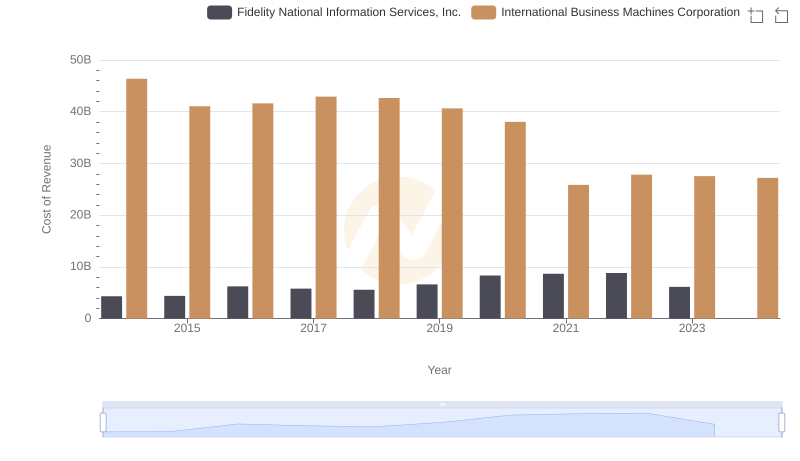
Analyzing Cost of Revenue: International Business Machines Corporation and Fidelity National Information Services, Inc.
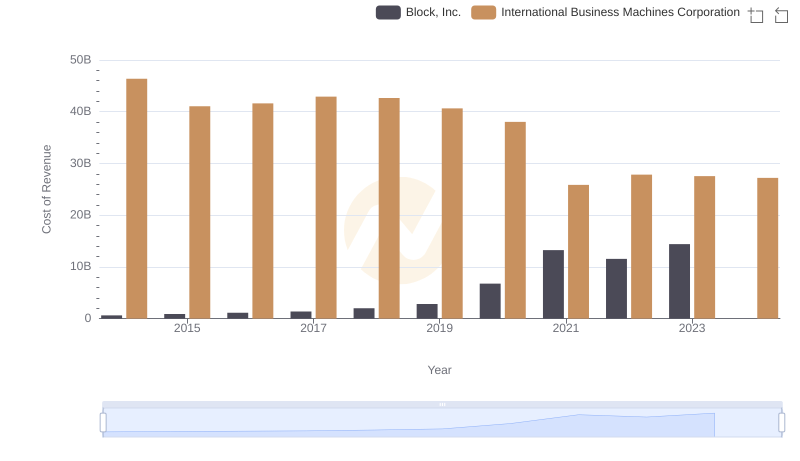
Cost Insights: Breaking Down International Business Machines Corporation and Block, Inc.'s Expenses
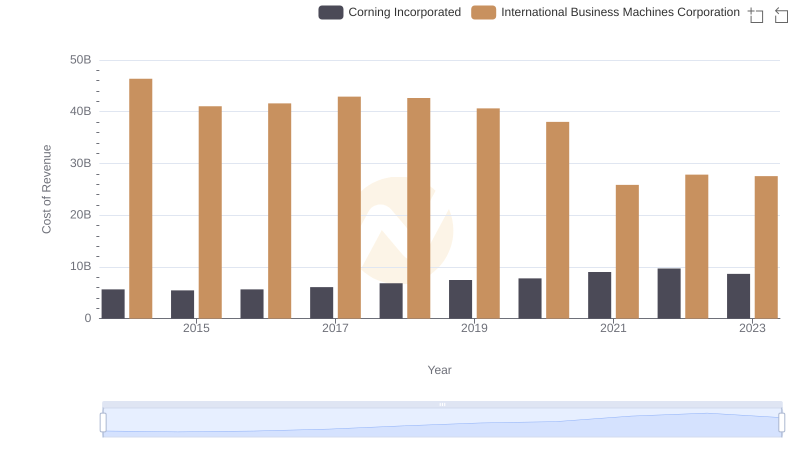
Cost of Revenue: Key Insights for International Business Machines Corporation and Corning Incorporated
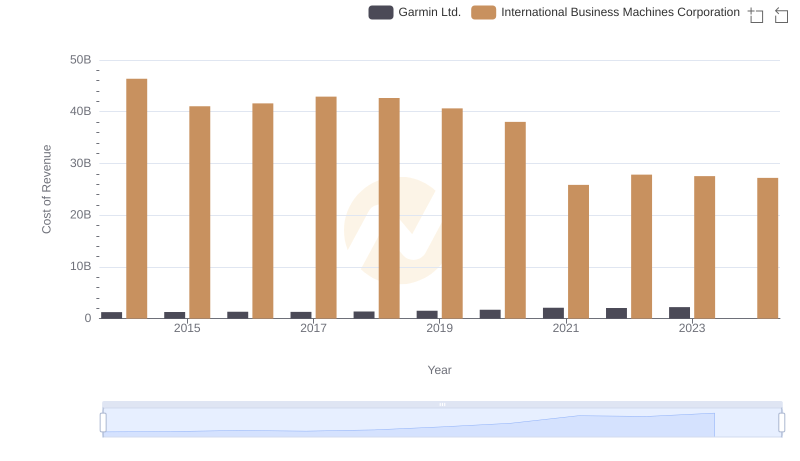
Cost of Revenue Comparison: International Business Machines Corporation vs Garmin Ltd.
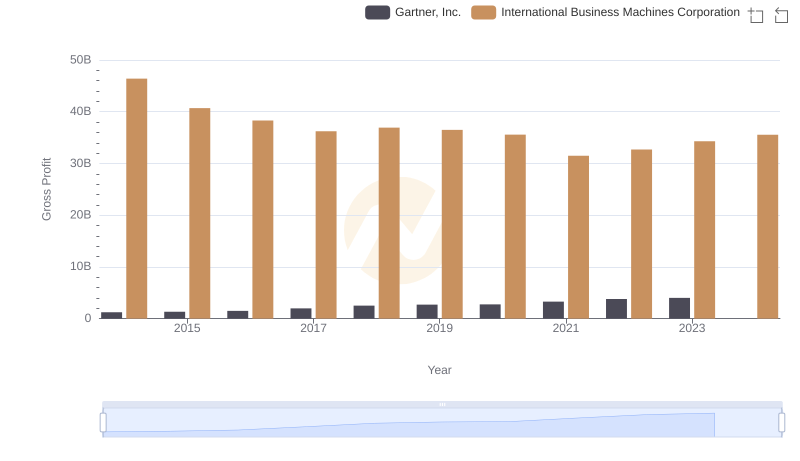
Who Generates Higher Gross Profit? International Business Machines Corporation or Gartner, Inc.
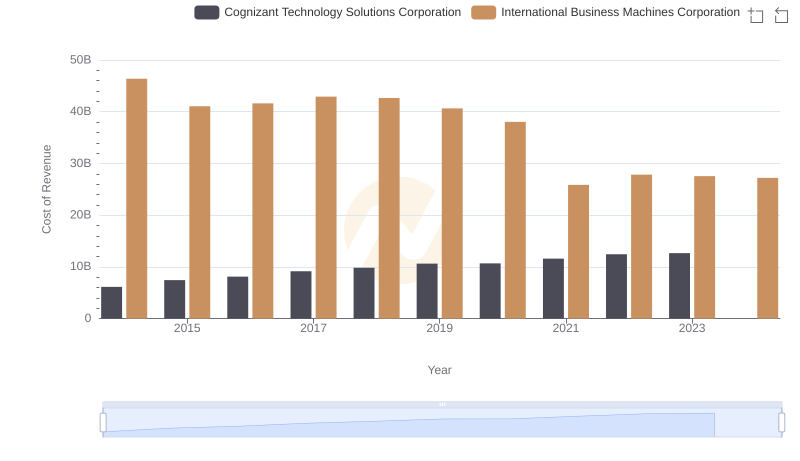
Analyzing Cost of Revenue: International Business Machines Corporation and Cognizant Technology Solutions Corporation
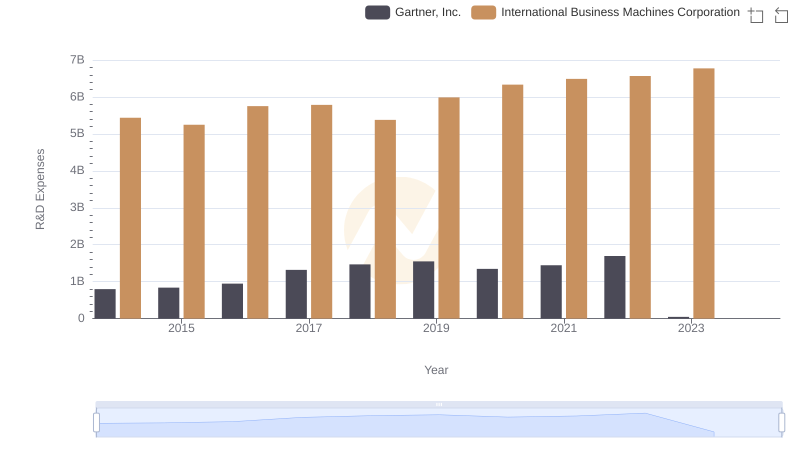
Research and Development Expenses Breakdown: International Business Machines Corporation vs Gartner, Inc.
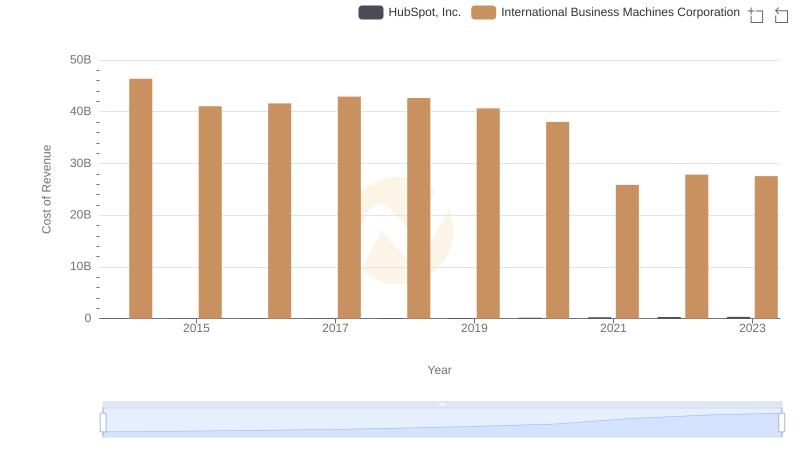
Cost of Revenue Trends: International Business Machines Corporation vs HubSpot, Inc.
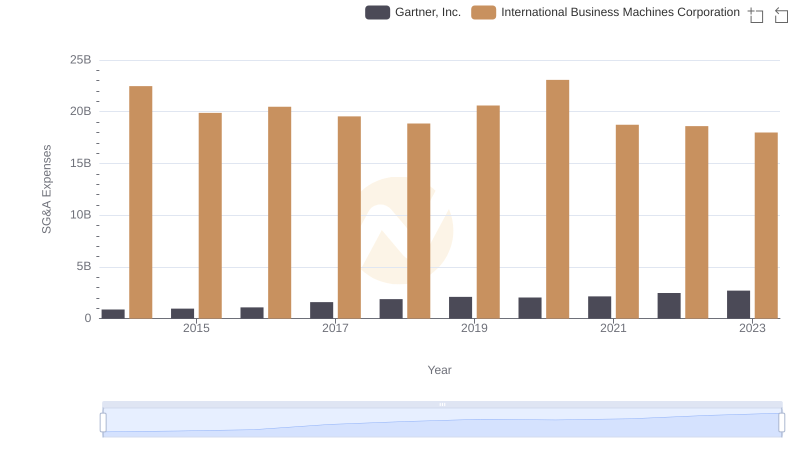
SG&A Efficiency Analysis: Comparing International Business Machines Corporation and Gartner, Inc.

International Business Machines Corporation vs Gartner, Inc.: In-Depth EBITDA Performance Comparison