| __timestamp | International Business Machines Corporation | VMware, Inc. |
|---|---|---|
| Wednesday, January 1, 2014 | 46386000000 | 730000000 |
| Thursday, January 1, 2015 | 41057000000 | 917000000 |
| Friday, January 1, 2016 | 41403000000 | 1018000000 |
| Sunday, January 1, 2017 | 42196000000 | 1053000000 |
| Monday, January 1, 2018 | 42655000000 | 1141000000 |
| Tuesday, January 1, 2019 | 26181000000 | 1258000000 |
| Wednesday, January 1, 2020 | 24314000000 | 1799000000 |
| Friday, January 1, 2021 | 25865000000 | 2043000000 |
| Saturday, January 1, 2022 | 27842000000 | 2271000000 |
| Sunday, January 1, 2023 | 27560000000 | 2482000000 |
| Monday, January 1, 2024 | 27202000000 |
Cracking the code
In the ever-evolving landscape of technology, understanding cost dynamics is crucial. From 2014 to 2023, International Business Machines Corporation (IBM) and VMware, Inc. have shown distinct trends in their cost of revenue. IBM, a stalwart in the tech industry, saw its cost of revenue peak in 2014, with a gradual decline of approximately 41% by 2023. This trend reflects IBM's strategic shift towards more efficient operations and possibly a focus on higher-margin services.
Conversely, VMware, a leader in cloud infrastructure and digital workspace technology, experienced a steady increase in its cost of revenue, growing by over 240% from 2014 to 2023. This rise indicates VMware's aggressive expansion and investment in innovation to capture market share. Notably, data for 2024 is incomplete, suggesting ongoing developments. These trends highlight the contrasting strategies of two tech giants in adapting to market demands.
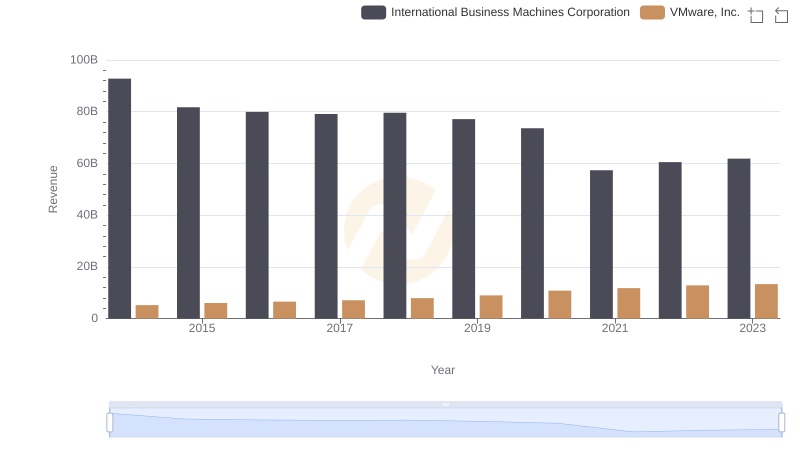
Revenue Insights: International Business Machines Corporation and VMware, Inc. Performance Compared
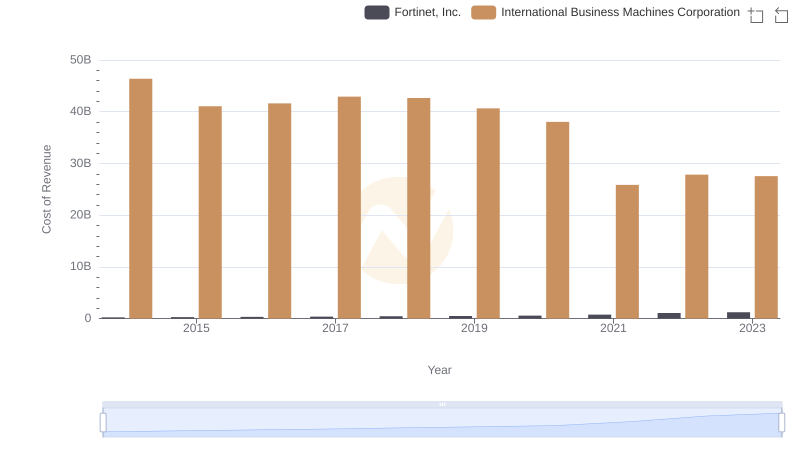
Cost Insights: Breaking Down International Business Machines Corporation and Fortinet, Inc.'s Expenses
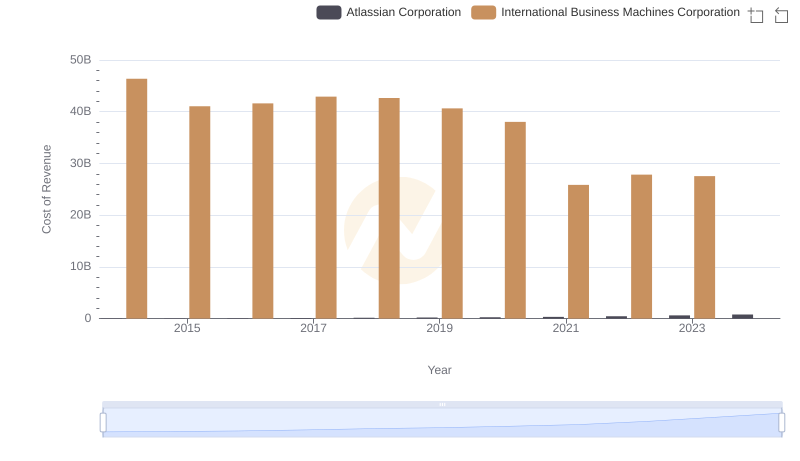
Cost of Revenue: Key Insights for International Business Machines Corporation and Atlassian Corporation
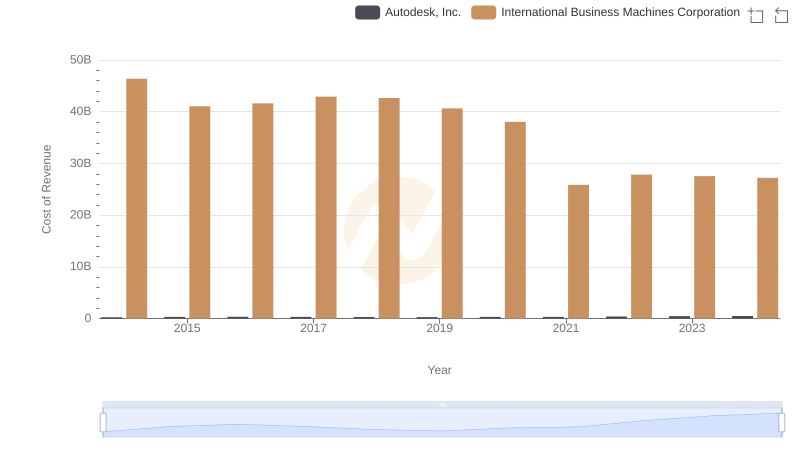
Cost of Revenue Trends: International Business Machines Corporation vs Autodesk, Inc.
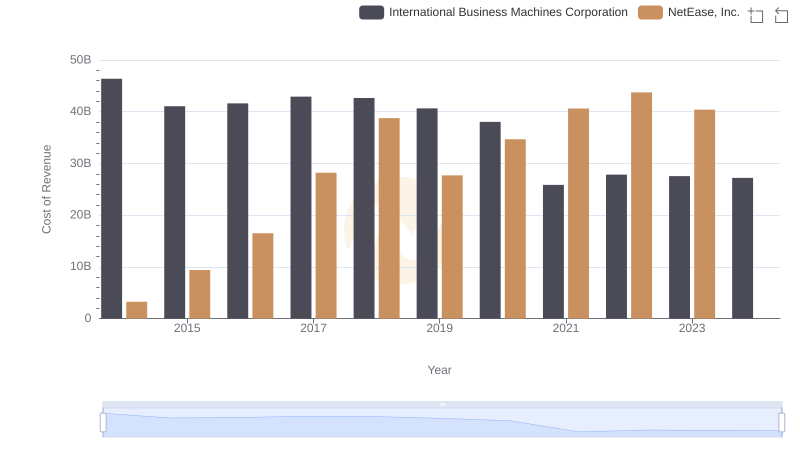
Cost of Revenue: Key Insights for International Business Machines Corporation and NetEase, Inc.
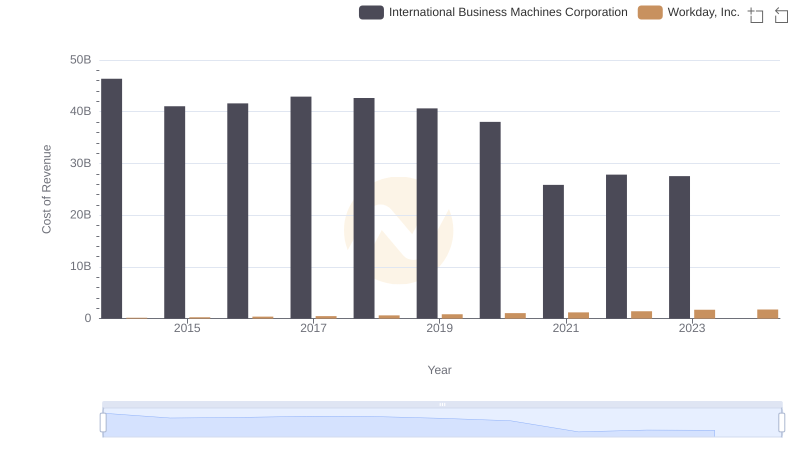
Cost of Revenue Comparison: International Business Machines Corporation vs Workday, Inc.
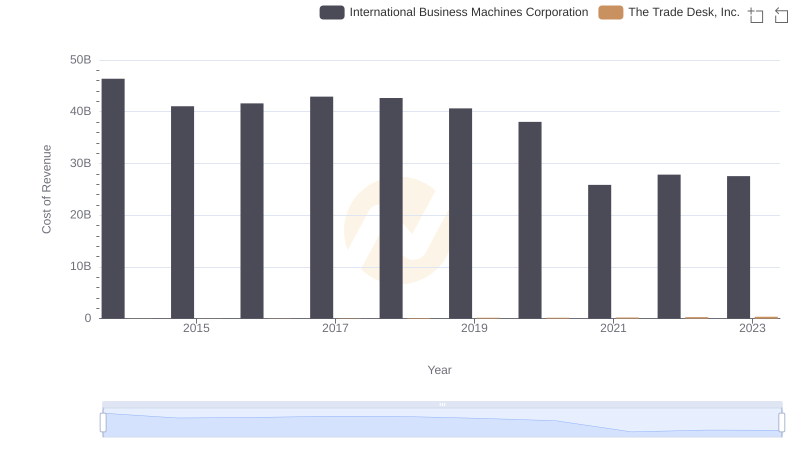
Cost Insights: Breaking Down International Business Machines Corporation and The Trade Desk, Inc.'s Expenses
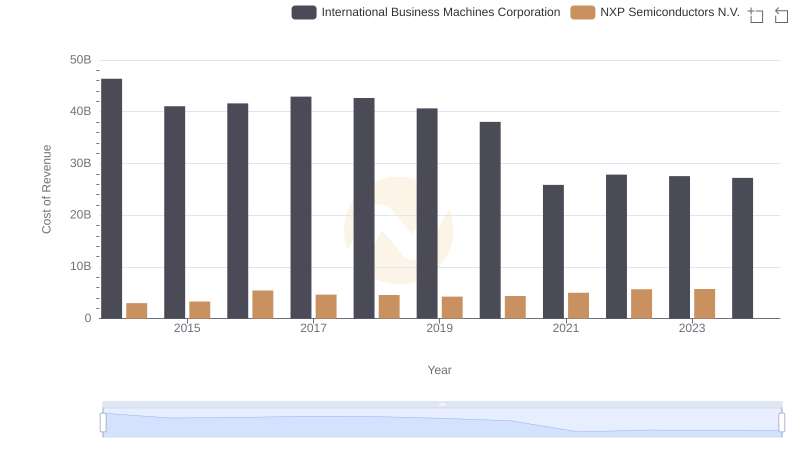
Cost of Revenue Comparison: International Business Machines Corporation vs NXP Semiconductors N.V.
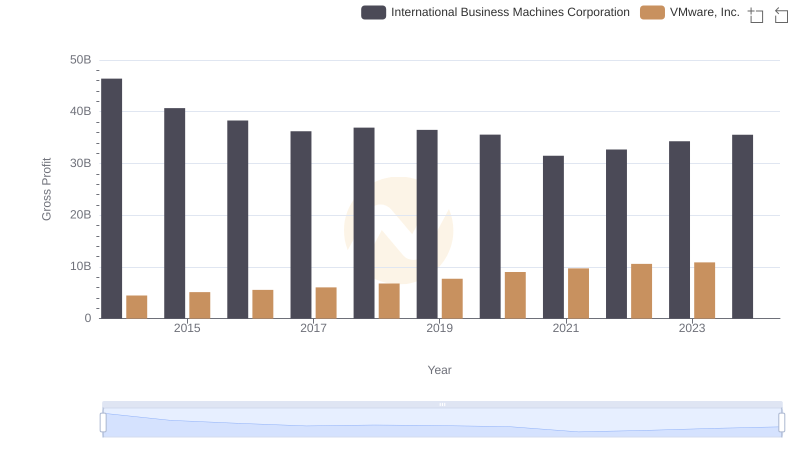
Gross Profit Analysis: Comparing International Business Machines Corporation and VMware, Inc.
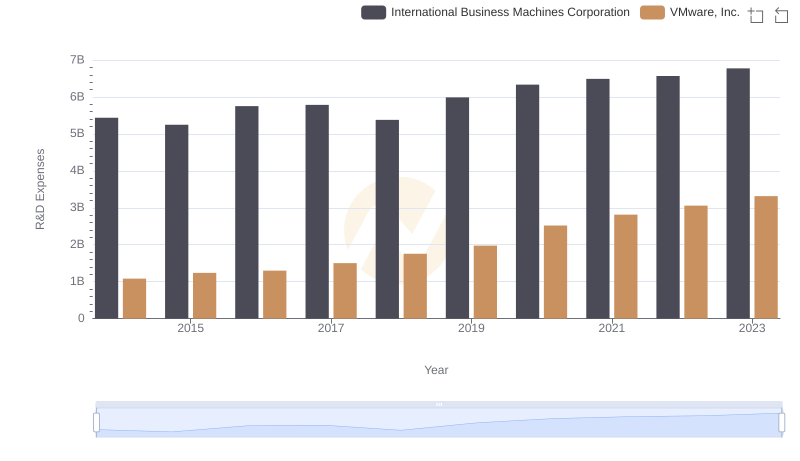
Research and Development: Comparing Key Metrics for International Business Machines Corporation and VMware, Inc.
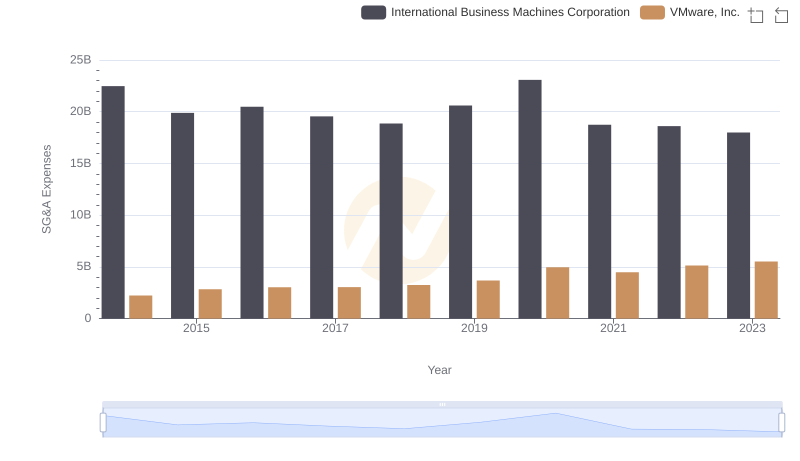
Breaking Down SG&A Expenses: International Business Machines Corporation vs VMware, Inc.

International Business Machines Corporation and VMware, Inc.: A Detailed Examination of EBITDA Performance