| __timestamp | Global Payments Inc. | United Rentals, Inc. |
|---|---|---|
| Wednesday, January 1, 2014 | 1022107000 | 3253000000 |
| Thursday, January 1, 2015 | 1147639000 | 3337000000 |
| Friday, January 1, 2016 | 1603532000 | 3359000000 |
| Sunday, January 1, 2017 | 1928037000 | 3872000000 |
| Monday, January 1, 2018 | 1095014000 | 4683000000 |
| Tuesday, January 1, 2019 | 2073803000 | 5681000000 |
| Wednesday, January 1, 2020 | 3650727000 | 5347000000 |
| Friday, January 1, 2021 | 3773725000 | 5863000000 |
| Saturday, January 1, 2022 | 3778617000 | 6646000000 |
| Sunday, January 1, 2023 | 3727521000 | 8519000000 |
| Monday, January 1, 2024 | 3760116000 | 9195000000 |
Unveiling the hidden dimensions of data
In the ever-evolving landscape of corporate finance, understanding cost efficiency is paramount. This analysis delves into the cost of revenue trends for United Rentals, Inc. and Global Payments Inc. from 2014 to 2023. Over this decade, United Rentals, Inc. consistently demonstrated a higher cost of revenue, peaking at approximately $8.5 billion in 2023, a staggering 162% increase from 2014. In contrast, Global Payments Inc. showed a more moderate growth, with its cost of revenue rising by about 265% over the same period, reaching nearly $3.7 billion in 2023. This disparity highlights United Rentals' expansive operational scale compared to Global Payments. However, the data for 2024 is incomplete, leaving room for speculation on future trends. As businesses navigate the complexities of cost management, these insights offer a glimpse into the strategic financial maneuvers of two industry giants.
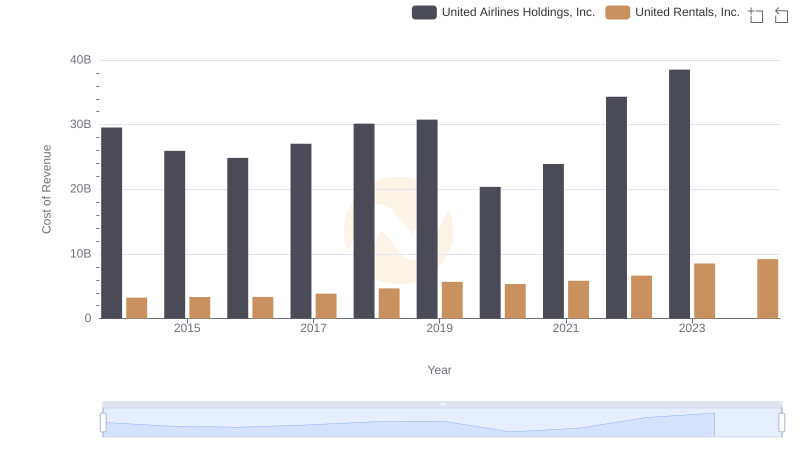
Cost Insights: Breaking Down United Rentals, Inc. and United Airlines Holdings, Inc.'s Expenses
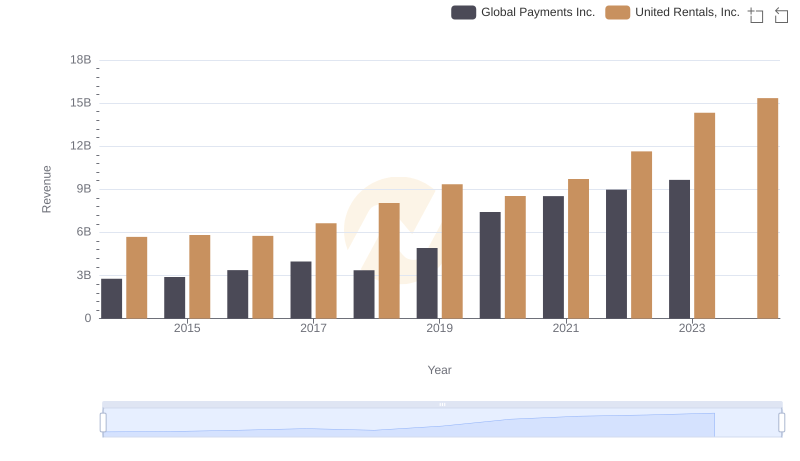
Comparing Revenue Performance: United Rentals, Inc. or Global Payments Inc.?
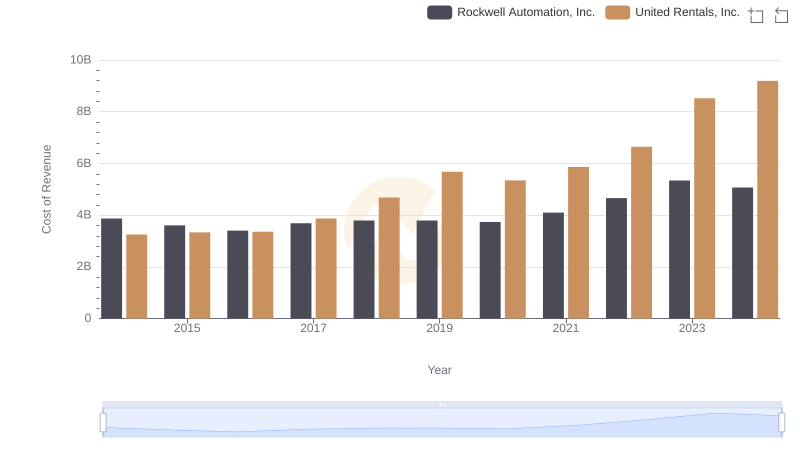
Cost of Revenue Comparison: United Rentals, Inc. vs Rockwell Automation, Inc.
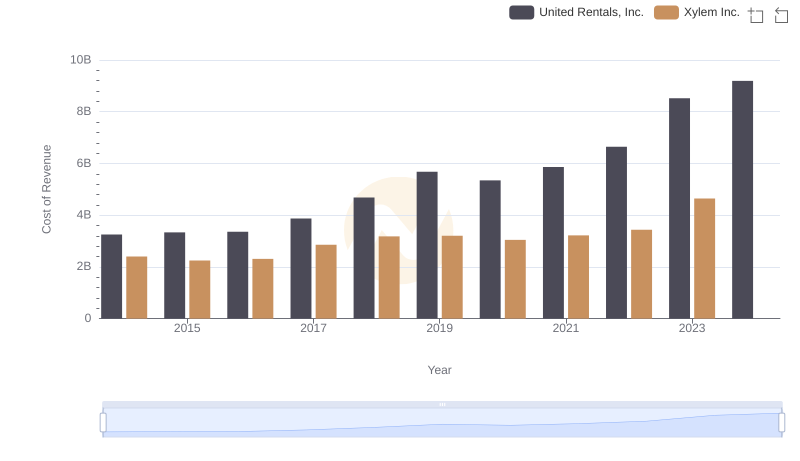
Cost of Revenue Comparison: United Rentals, Inc. vs Xylem Inc.
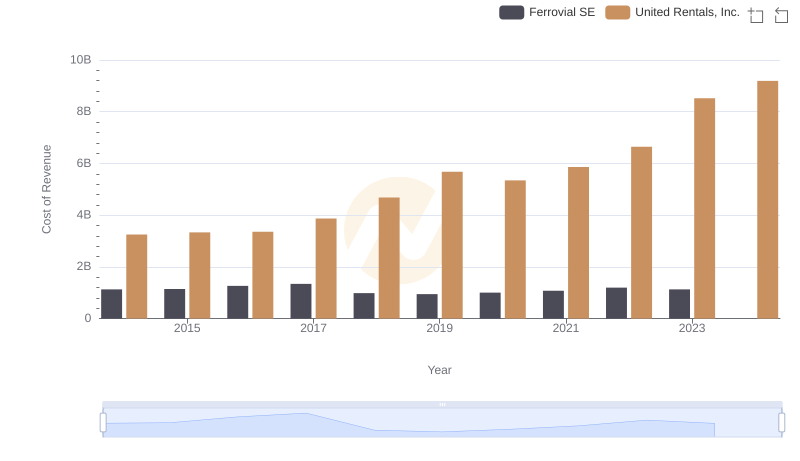
Analyzing Cost of Revenue: United Rentals, Inc. and Ferrovial SE
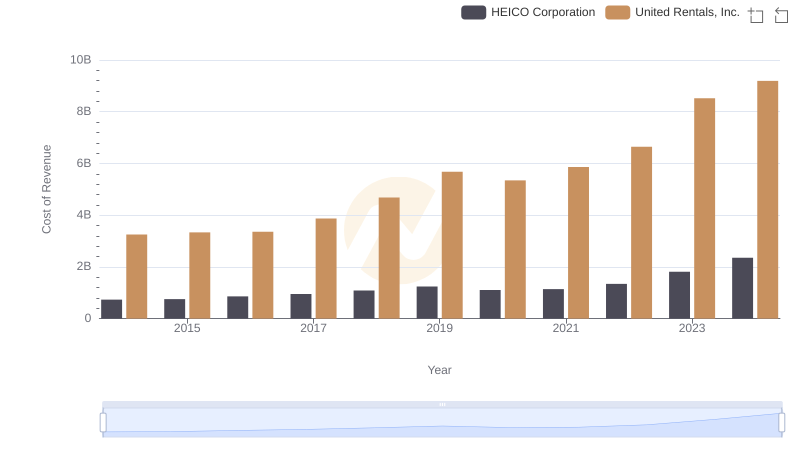
United Rentals, Inc. vs HEICO Corporation: Efficiency in Cost of Revenue Explored
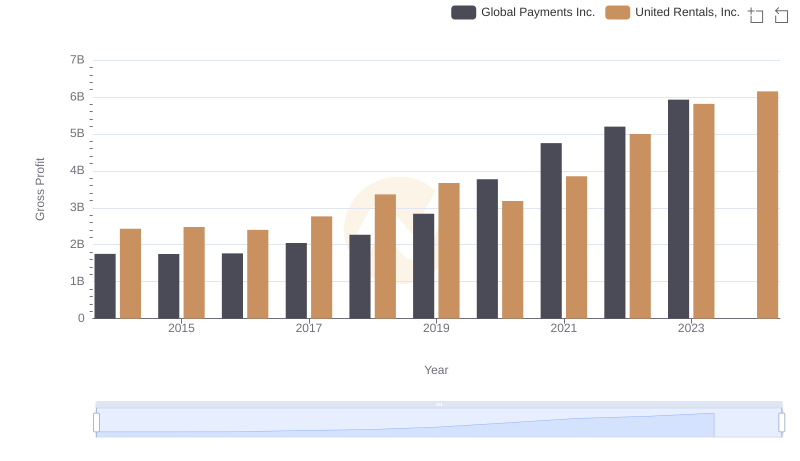
United Rentals, Inc. vs Global Payments Inc.: A Gross Profit Performance Breakdown
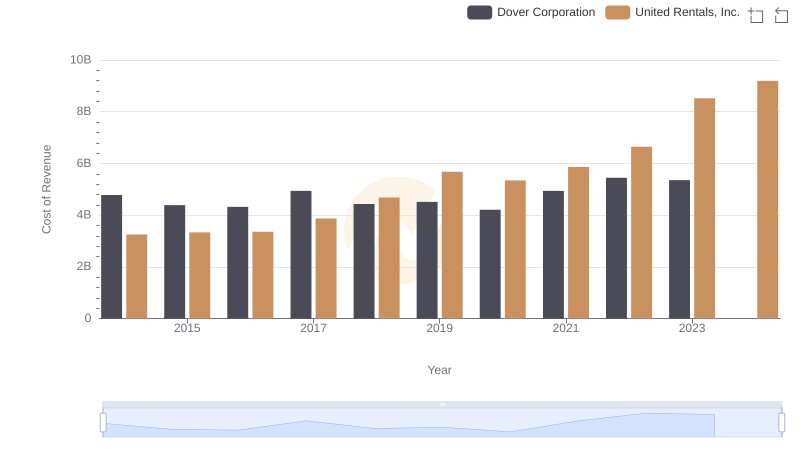
Cost Insights: Breaking Down United Rentals, Inc. and Dover Corporation's Expenses
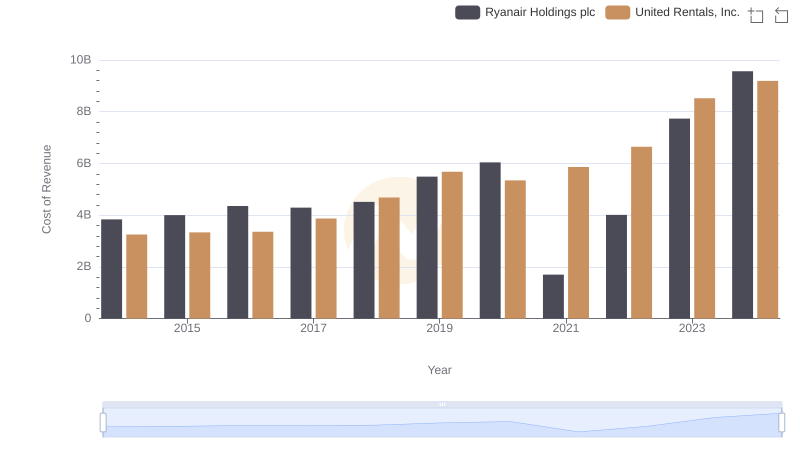
Cost Insights: Breaking Down United Rentals, Inc. and Ryanair Holdings plc's Expenses
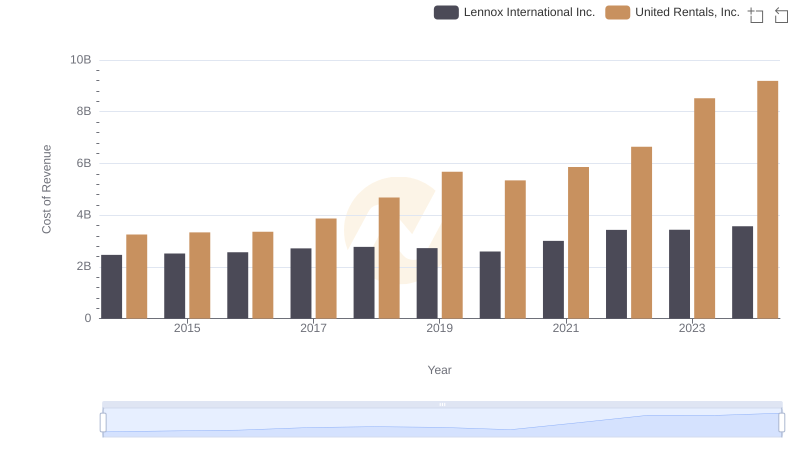
Cost of Revenue Trends: United Rentals, Inc. vs Lennox International Inc.
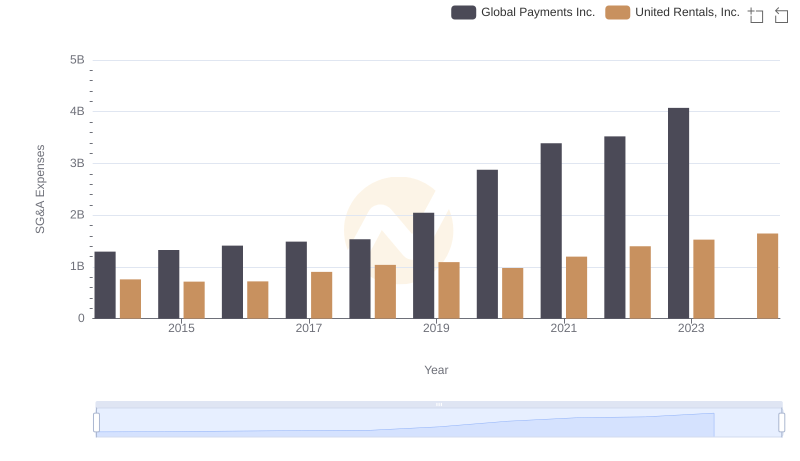
United Rentals, Inc. and Global Payments Inc.: SG&A Spending Patterns Compared
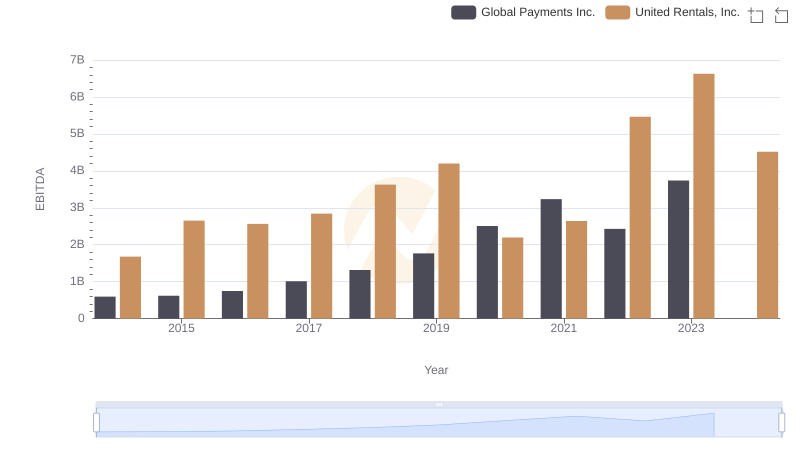
A Side-by-Side Analysis of EBITDA: United Rentals, Inc. and Global Payments Inc.