| __timestamp | Rockwell Automation, Inc. | United Rentals, Inc. |
|---|---|---|
| Wednesday, January 1, 2014 | 3869600000 | 3253000000 |
| Thursday, January 1, 2015 | 3604800000 | 3337000000 |
| Friday, January 1, 2016 | 3404000000 | 3359000000 |
| Sunday, January 1, 2017 | 3687100000 | 3872000000 |
| Monday, January 1, 2018 | 3793800000 | 4683000000 |
| Tuesday, January 1, 2019 | 3794700000 | 5681000000 |
| Wednesday, January 1, 2020 | 3734600000 | 5347000000 |
| Friday, January 1, 2021 | 4099700000 | 5863000000 |
| Saturday, January 1, 2022 | 4658400000 | 6646000000 |
| Sunday, January 1, 2023 | 5341000000 | 8519000000 |
| Monday, January 1, 2024 | 5070800000 | 9195000000 |
Unleashing the power of data
In the ever-evolving landscape of industrial equipment and automation, United Rentals, Inc. and Rockwell Automation, Inc. stand as titans. Over the past decade, these companies have showcased contrasting trajectories in their cost of revenue. From 2014 to 2024, United Rentals has seen a staggering 183% increase, peaking in 2024, while Rockwell Automation's costs rose by 31% over the same period. This divergence highlights United Rentals' aggressive expansion strategy, as it consistently outpaces Rockwell Automation in cost growth. Notably, 2023 marked a pivotal year, with United Rentals' costs surpassing Rockwell Automation by 60%. As we look to the future, these trends offer a window into the strategic priorities of each company, with United Rentals focusing on scaling operations and Rockwell Automation maintaining a steady course. This data not only reflects past performance but also sets the stage for future industry dynamics.
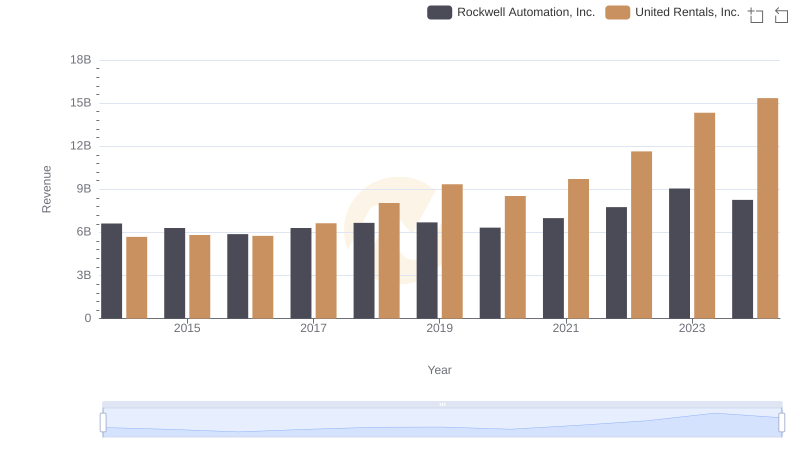
Annual Revenue Comparison: United Rentals, Inc. vs Rockwell Automation, Inc.
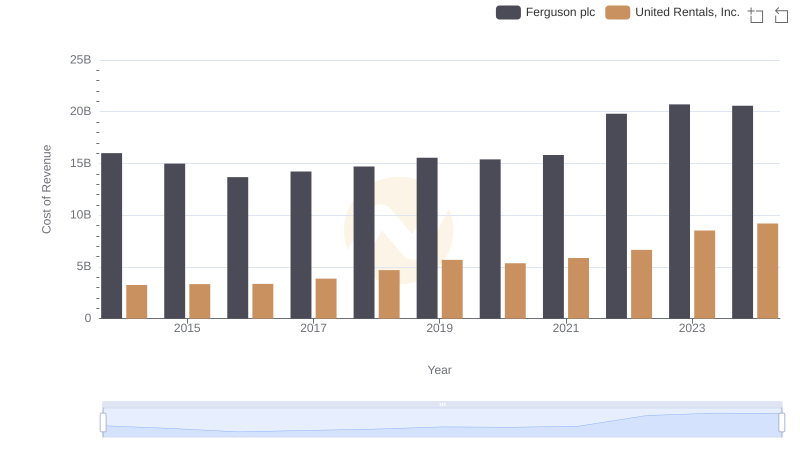
Cost of Revenue Comparison: United Rentals, Inc. vs Ferguson plc
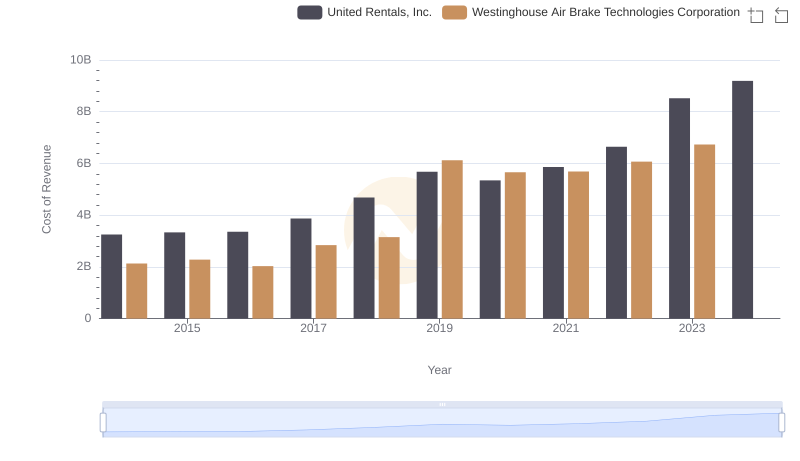
United Rentals, Inc. vs Westinghouse Air Brake Technologies Corporation: Efficiency in Cost of Revenue Explored
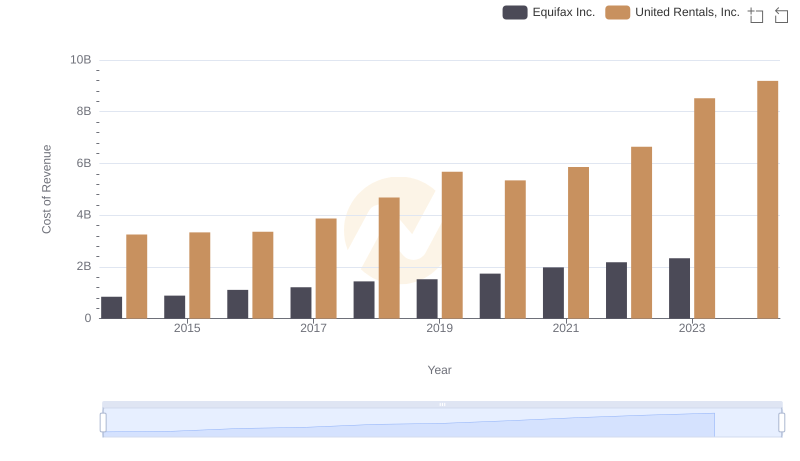
United Rentals, Inc. vs Equifax Inc.: Efficiency in Cost of Revenue Explored
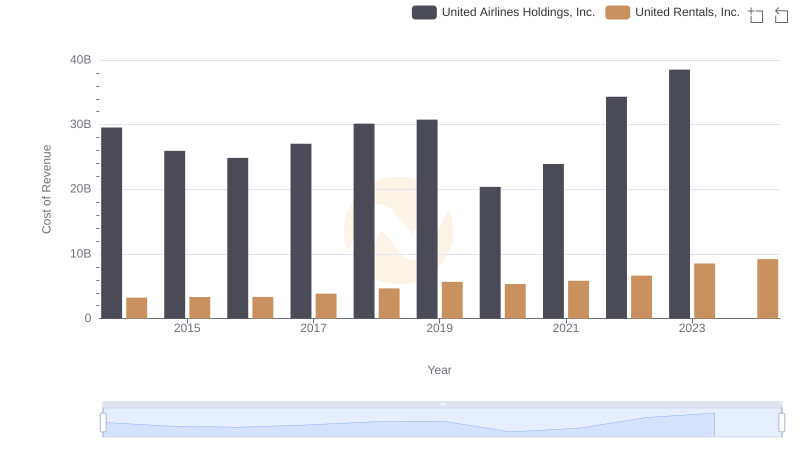
Cost Insights: Breaking Down United Rentals, Inc. and United Airlines Holdings, Inc.'s Expenses
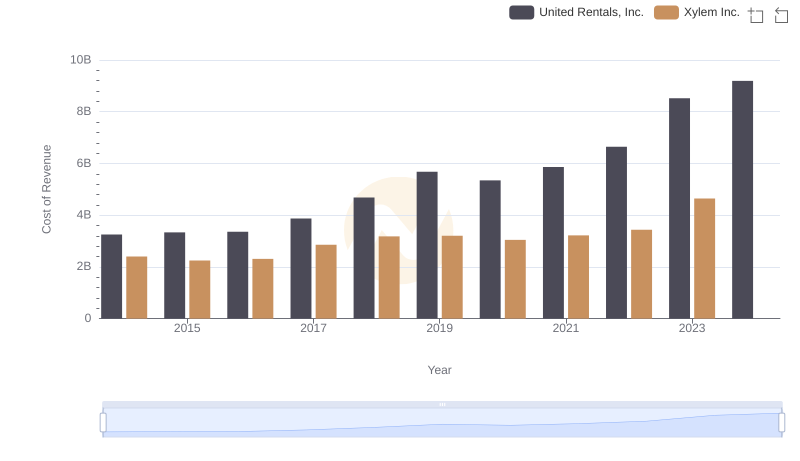
Cost of Revenue Comparison: United Rentals, Inc. vs Xylem Inc.
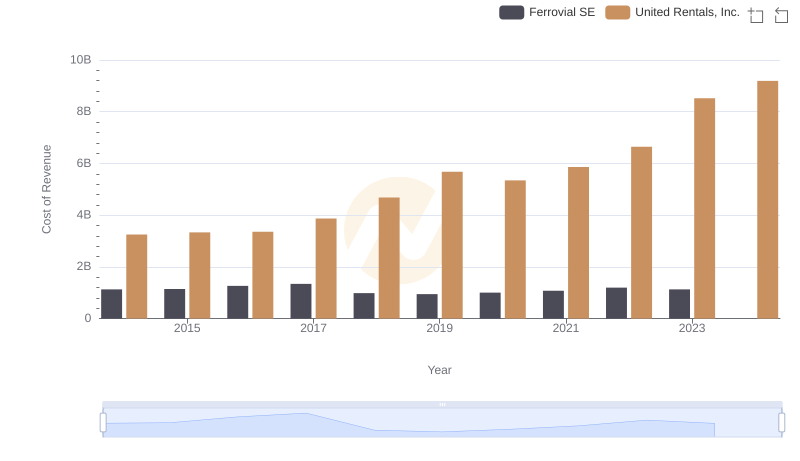
Analyzing Cost of Revenue: United Rentals, Inc. and Ferrovial SE
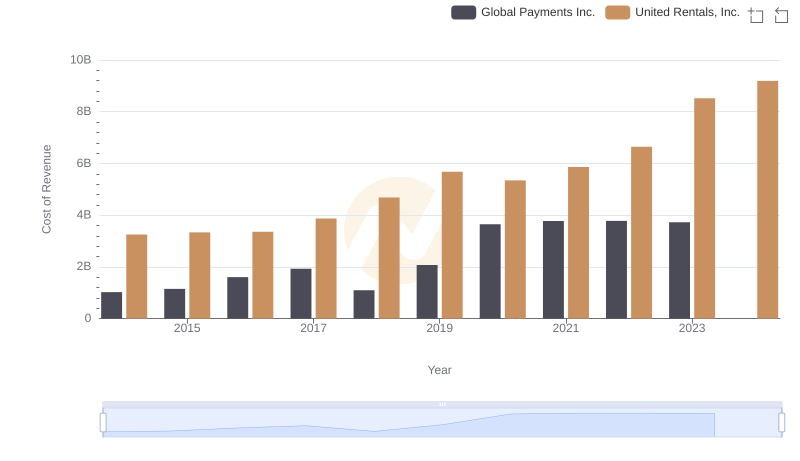
United Rentals, Inc. vs Global Payments Inc.: Efficiency in Cost of Revenue Explored
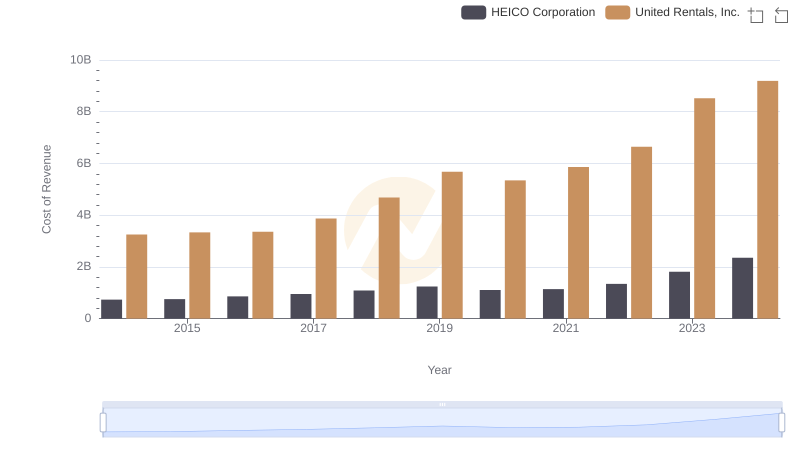
United Rentals, Inc. vs HEICO Corporation: Efficiency in Cost of Revenue Explored
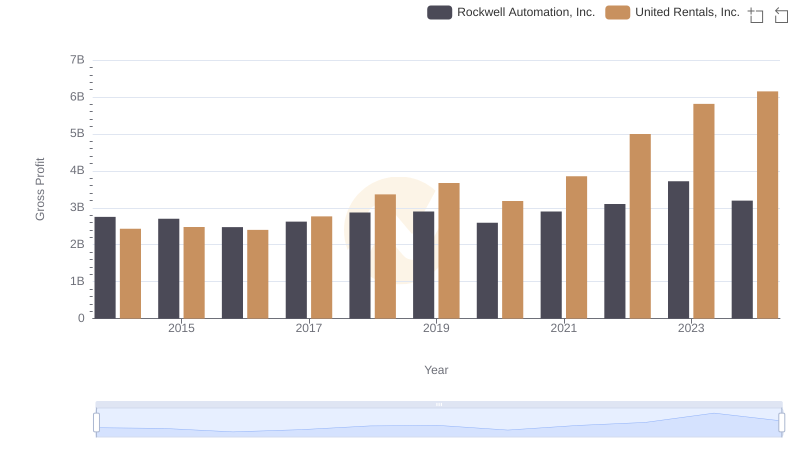
Who Generates Higher Gross Profit? United Rentals, Inc. or Rockwell Automation, Inc.
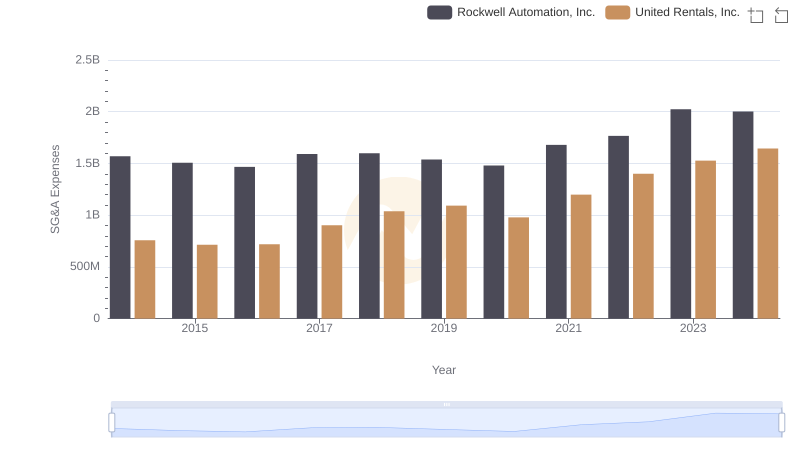
United Rentals, Inc. vs Rockwell Automation, Inc.: SG&A Expense Trends
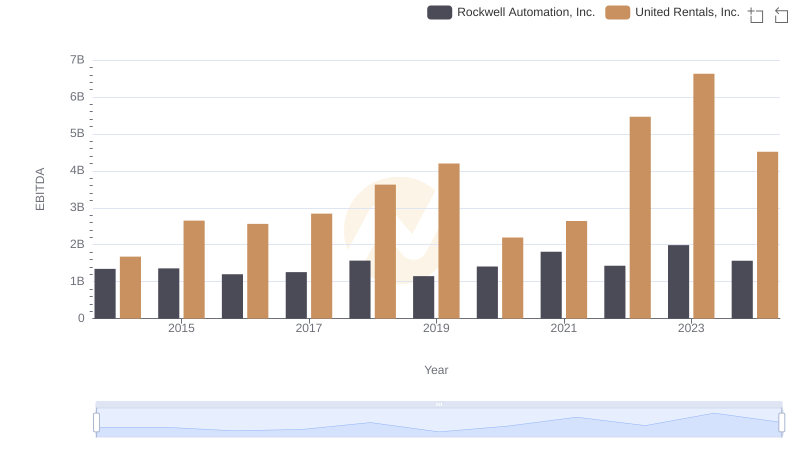
EBITDA Metrics Evaluated: United Rentals, Inc. vs Rockwell Automation, Inc.