| __timestamp | Ferrovial SE | United Rentals, Inc. |
|---|---|---|
| Wednesday, January 1, 2014 | 1131000000 | 3253000000 |
| Thursday, January 1, 2015 | 1143000000 | 3337000000 |
| Friday, January 1, 2016 | 1267000000 | 3359000000 |
| Sunday, January 1, 2017 | 1345000000 | 3872000000 |
| Monday, January 1, 2018 | 985000000 | 4683000000 |
| Tuesday, January 1, 2019 | 949000000 | 5681000000 |
| Wednesday, January 1, 2020 | 1005000000 | 5347000000 |
| Friday, January 1, 2021 | 1077000000 | 5863000000 |
| Saturday, January 1, 2022 | 1197000000 | 6646000000 |
| Sunday, January 1, 2023 | 1129000000 | 8519000000 |
| Monday, January 1, 2024 | 9195000000 |
In pursuit of knowledge
In the ever-evolving landscape of global business, understanding the cost of revenue is crucial for evaluating a company's financial health. This analysis focuses on two industry titans: United Rentals, Inc. and Ferrovial SE, from 2014 to 2023.
United Rentals, Inc., a leader in equipment rental, has seen its cost of revenue soar by approximately 162% over the decade, peaking in 2023. This growth reflects the company's aggressive expansion and increased market demand. In contrast, Ferrovial SE, a Spanish multinational in infrastructure, experienced a more modest 6% fluctuation, indicating stable operations with a focus on efficiency.
Interestingly, 2024 data for Ferrovial SE is missing, highlighting potential reporting delays or strategic shifts. This comparative analysis underscores the diverse strategies and market dynamics influencing these global players. Stay tuned as we delve deeper into the financial narratives shaping the future of these companies.
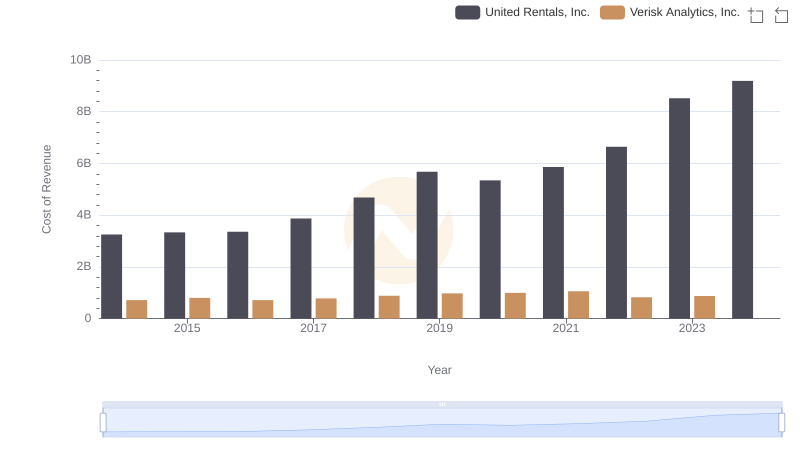
Cost of Revenue Comparison: United Rentals, Inc. vs Verisk Analytics, Inc.
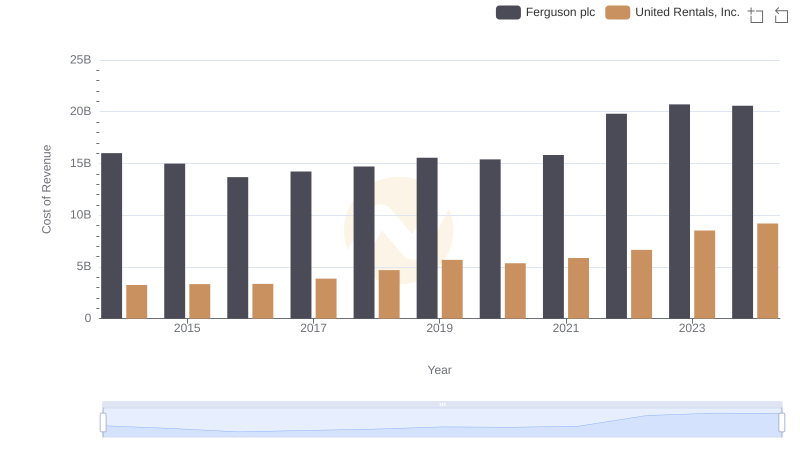
Cost of Revenue Comparison: United Rentals, Inc. vs Ferguson plc
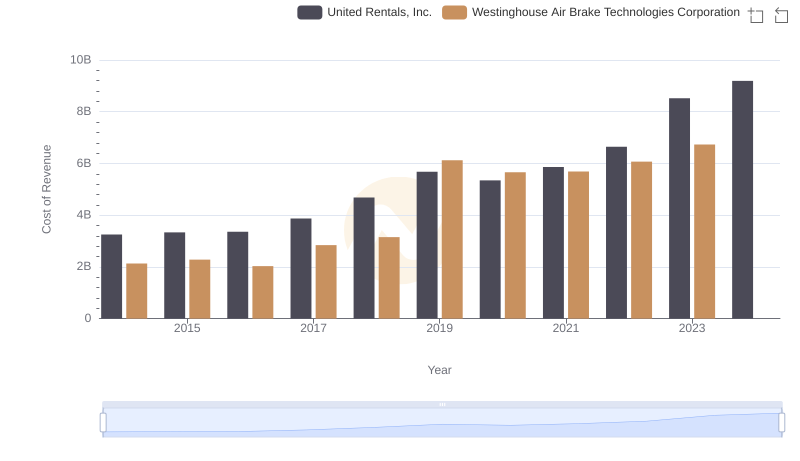
United Rentals, Inc. vs Westinghouse Air Brake Technologies Corporation: Efficiency in Cost of Revenue Explored
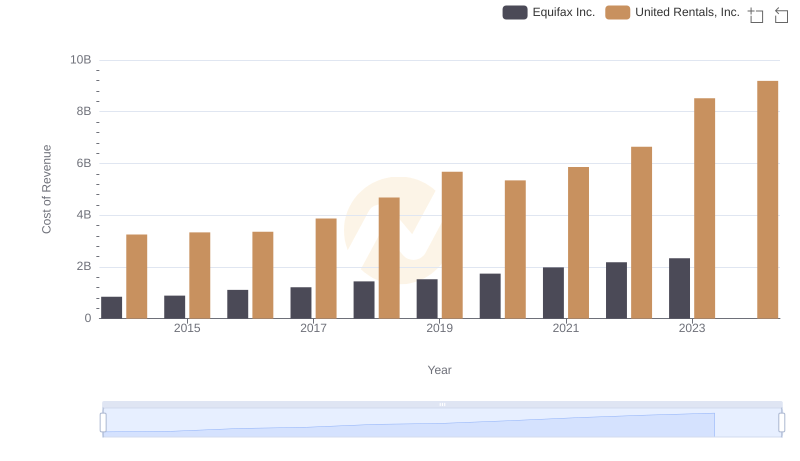
United Rentals, Inc. vs Equifax Inc.: Efficiency in Cost of Revenue Explored
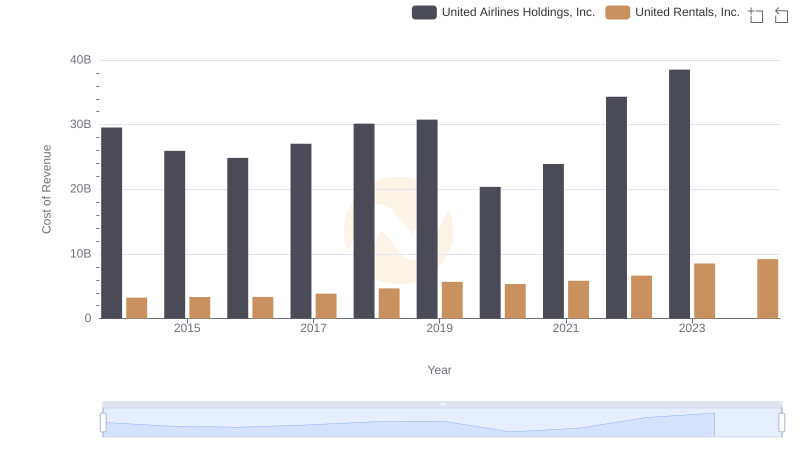
Cost Insights: Breaking Down United Rentals, Inc. and United Airlines Holdings, Inc.'s Expenses
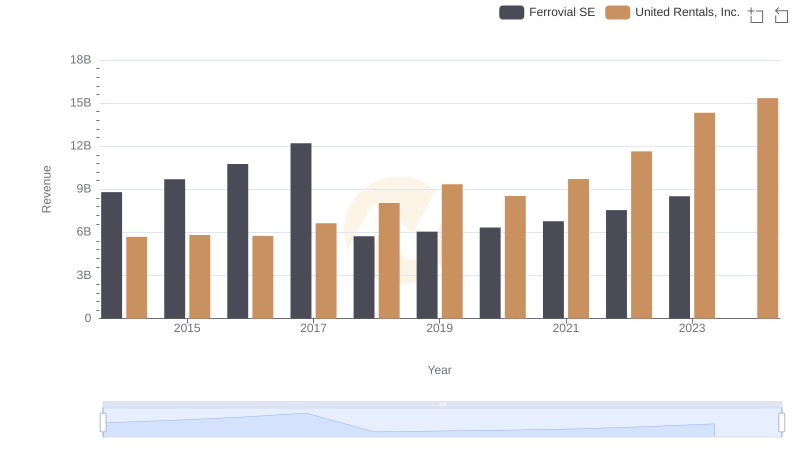
United Rentals, Inc. or Ferrovial SE: Who Leads in Yearly Revenue?
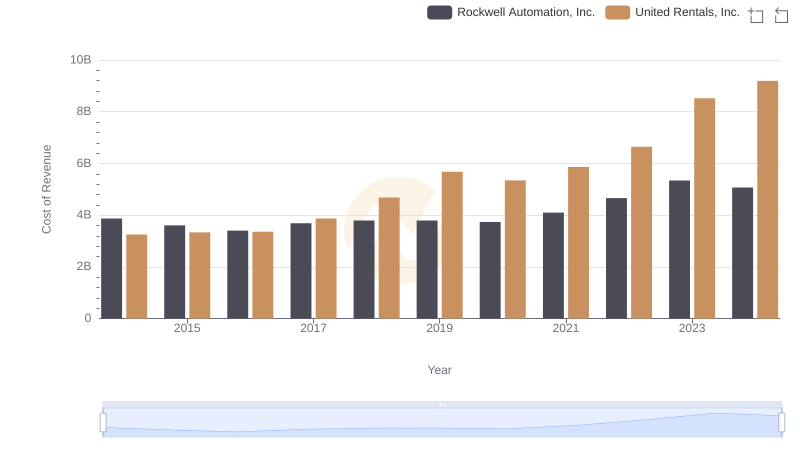
Cost of Revenue Comparison: United Rentals, Inc. vs Rockwell Automation, Inc.
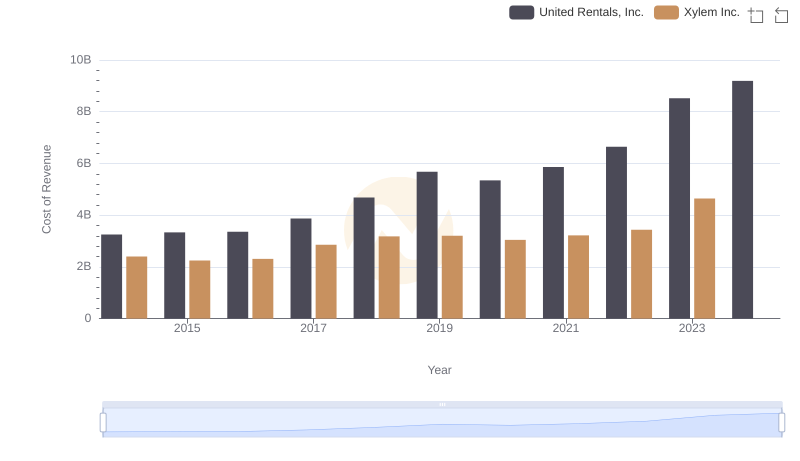
Cost of Revenue Comparison: United Rentals, Inc. vs Xylem Inc.
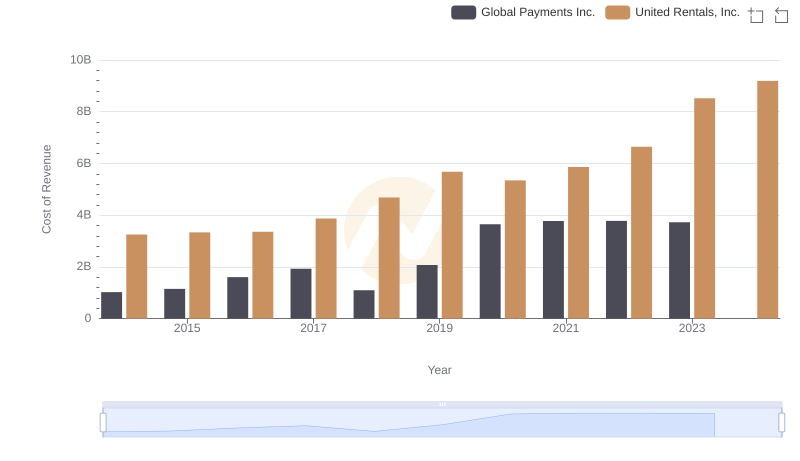
United Rentals, Inc. vs Global Payments Inc.: Efficiency in Cost of Revenue Explored
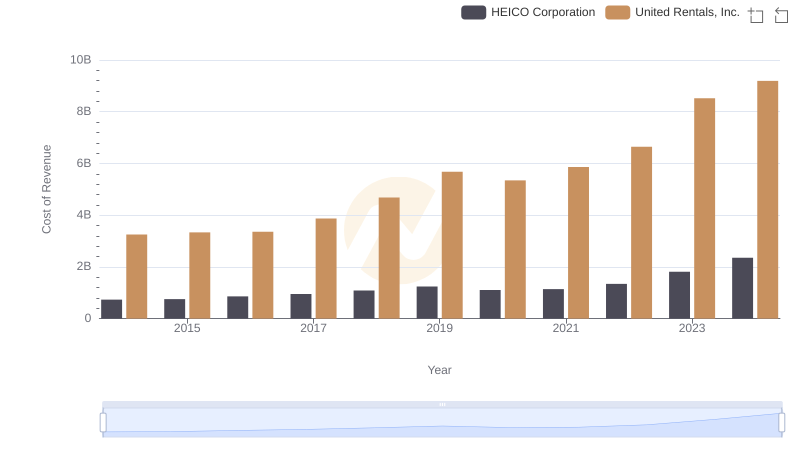
United Rentals, Inc. vs HEICO Corporation: Efficiency in Cost of Revenue Explored
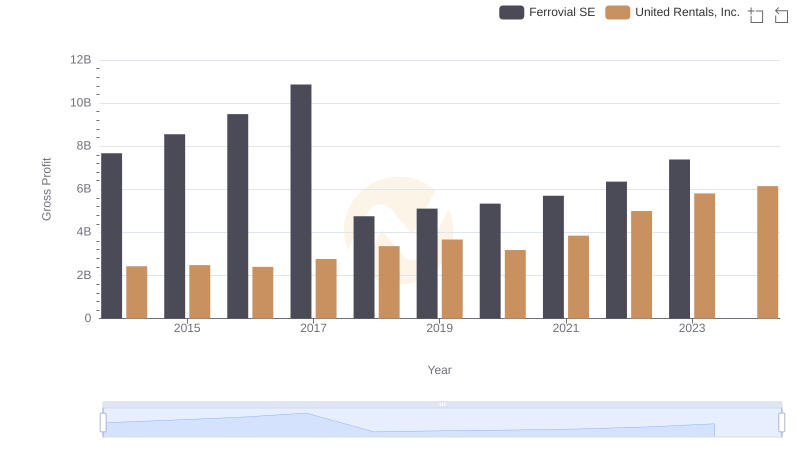
Who Generates Higher Gross Profit? United Rentals, Inc. or Ferrovial SE
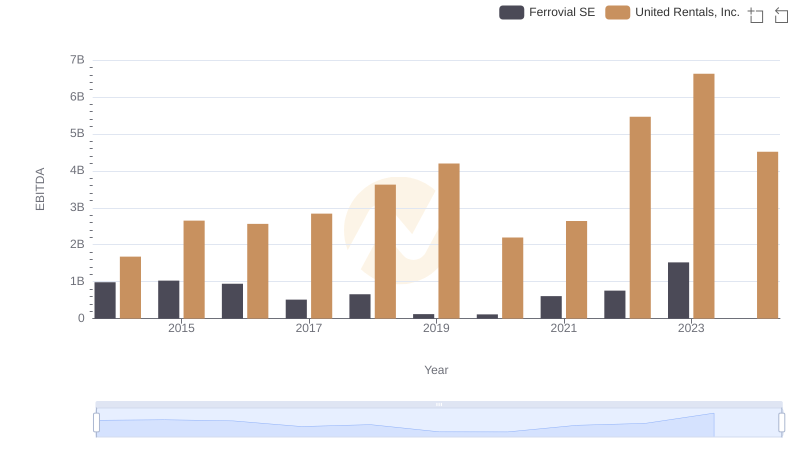
United Rentals, Inc. vs Ferrovial SE: In-Depth EBITDA Performance Comparison