| __timestamp | Global Payments Inc. | United Rentals, Inc. |
|---|---|---|
| Wednesday, January 1, 2014 | 1751611000 | 2432000000 |
| Thursday, January 1, 2015 | 1750511000 | 2480000000 |
| Friday, January 1, 2016 | 1767444000 | 2403000000 |
| Sunday, January 1, 2017 | 2047126000 | 2769000000 |
| Monday, January 1, 2018 | 2271352000 | 3364000000 |
| Tuesday, January 1, 2019 | 2838089000 | 3670000000 |
| Wednesday, January 1, 2020 | 3772831000 | 3183000000 |
| Friday, January 1, 2021 | 4750037000 | 3853000000 |
| Saturday, January 1, 2022 | 5196898000 | 4996000000 |
| Sunday, January 1, 2023 | 5926898000 | 5813000000 |
| Monday, January 1, 2024 | 6345778000 | 6150000000 |
Unleashing insights
In the ever-evolving landscape of corporate finance, the gross profit performance of United Rentals, Inc. and Global Payments Inc. offers a fascinating glimpse into their financial trajectories over the past decade. From 2014 to 2023, United Rentals, Inc. has consistently demonstrated robust growth, with its gross profit surging by approximately 139%, peaking at $5.81 billion in 2023. Meanwhile, Global Payments Inc. has not lagged far behind, showcasing an impressive 238% increase, reaching $5.93 billion in the same year.
This performance underscores the resilience and strategic prowess of both companies in navigating market challenges. Notably, United Rentals, Inc. maintained a steady upward trend, while Global Payments Inc. experienced a more volatile yet rewarding journey. As we look to the future, the absence of data for 2024 for Global Payments Inc. leaves us eagerly anticipating their next financial chapter.
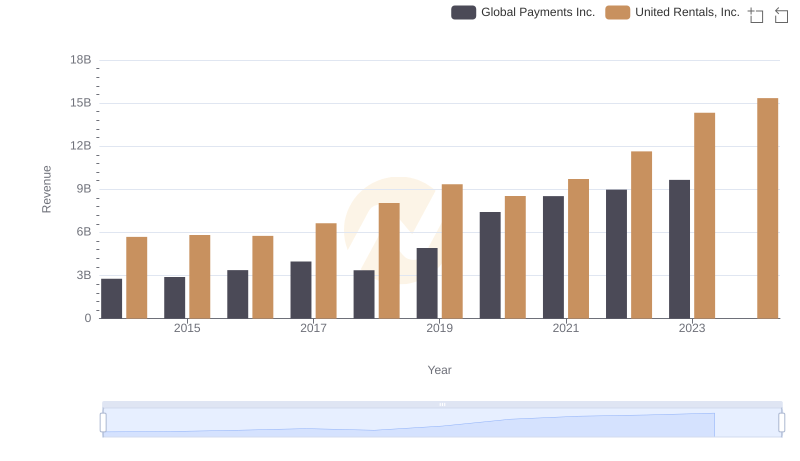
Comparing Revenue Performance: United Rentals, Inc. or Global Payments Inc.?
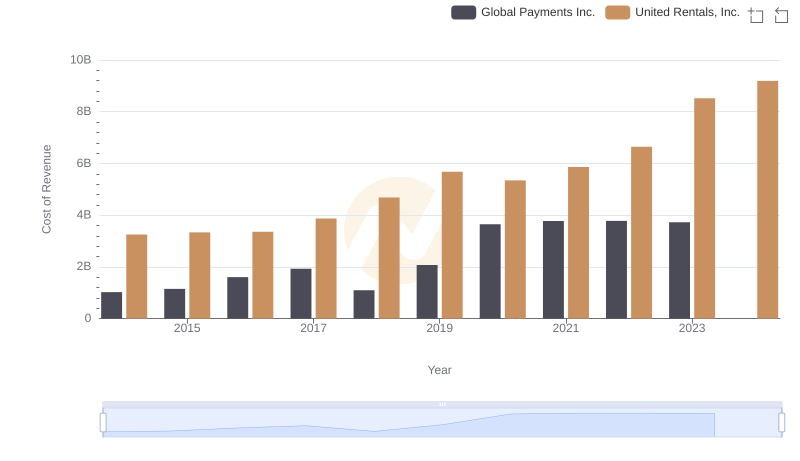
United Rentals, Inc. vs Global Payments Inc.: Efficiency in Cost of Revenue Explored
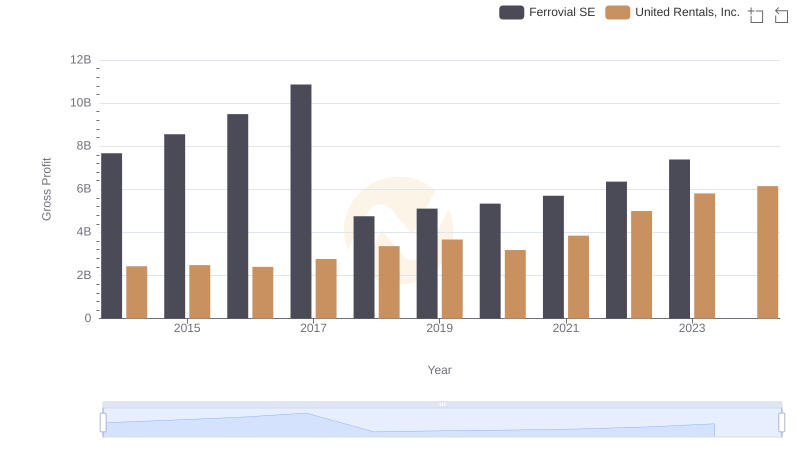
Who Generates Higher Gross Profit? United Rentals, Inc. or Ferrovial SE
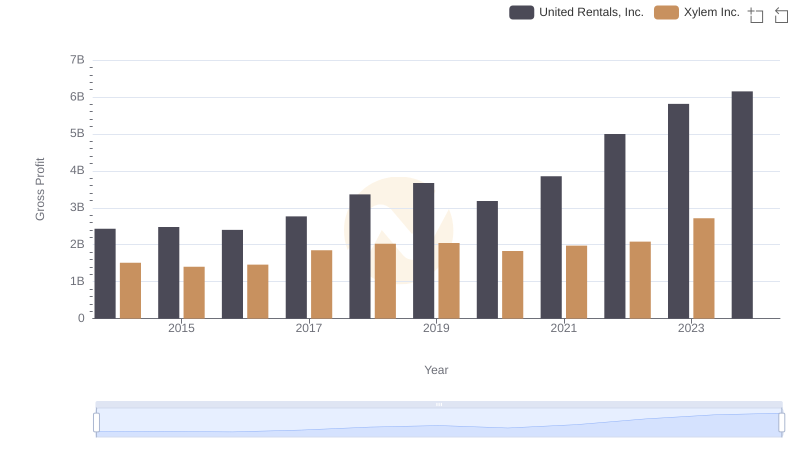
Gross Profit Comparison: United Rentals, Inc. and Xylem Inc. Trends
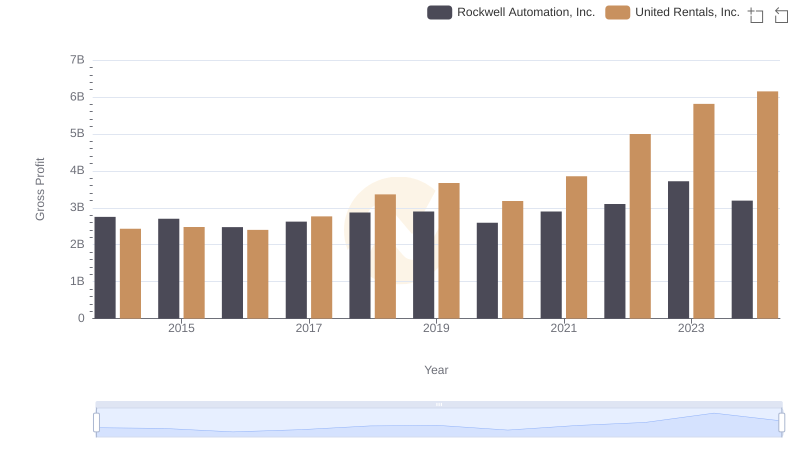
Who Generates Higher Gross Profit? United Rentals, Inc. or Rockwell Automation, Inc.
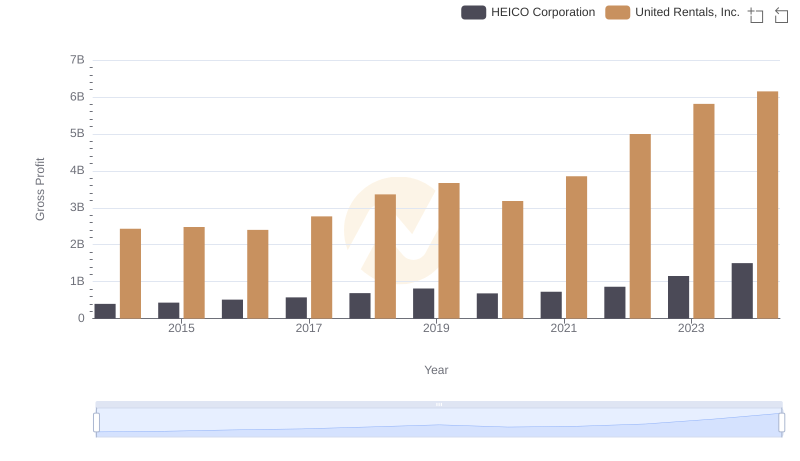
Who Generates Higher Gross Profit? United Rentals, Inc. or HEICO Corporation
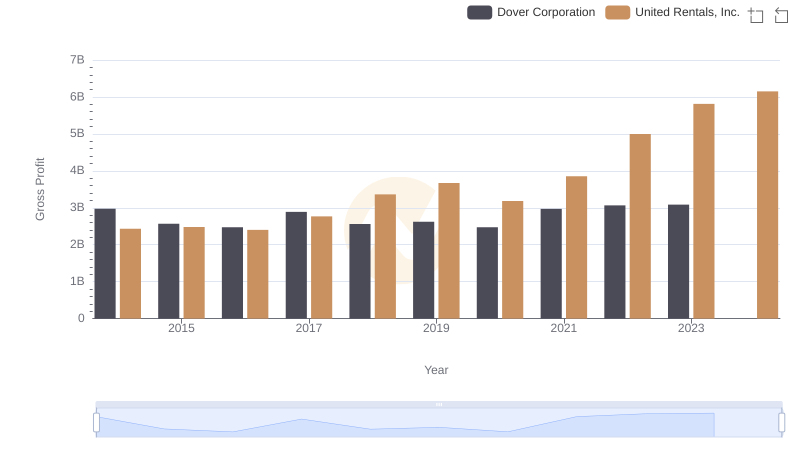
Gross Profit Trends Compared: United Rentals, Inc. vs Dover Corporation
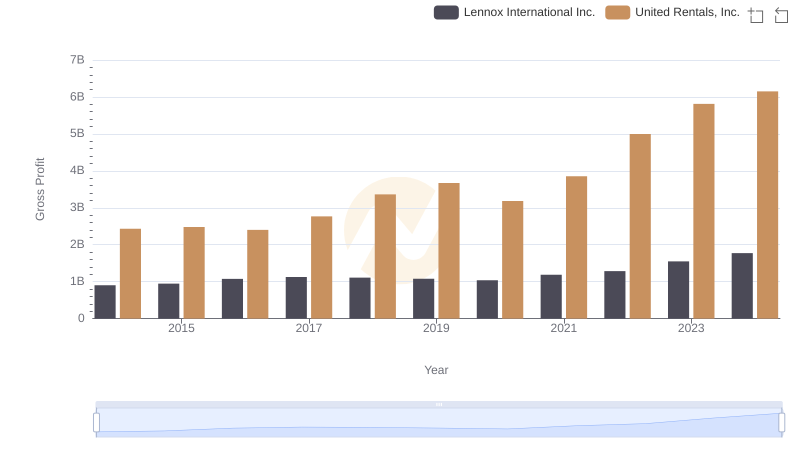
Gross Profit Comparison: United Rentals, Inc. and Lennox International Inc. Trends
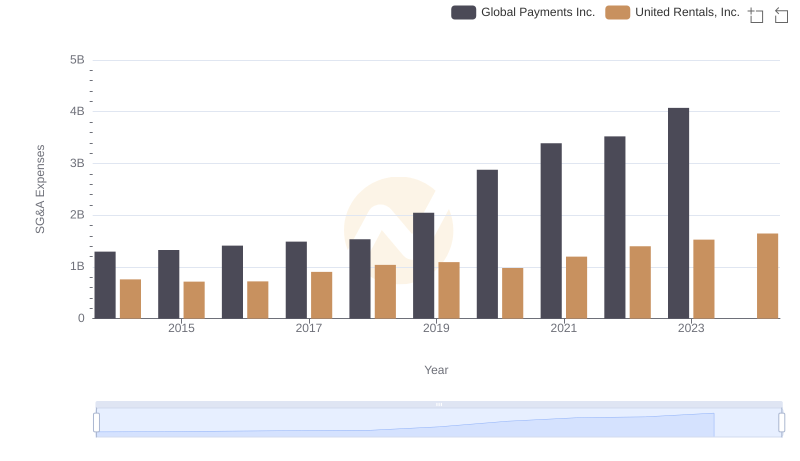
United Rentals, Inc. and Global Payments Inc.: SG&A Spending Patterns Compared
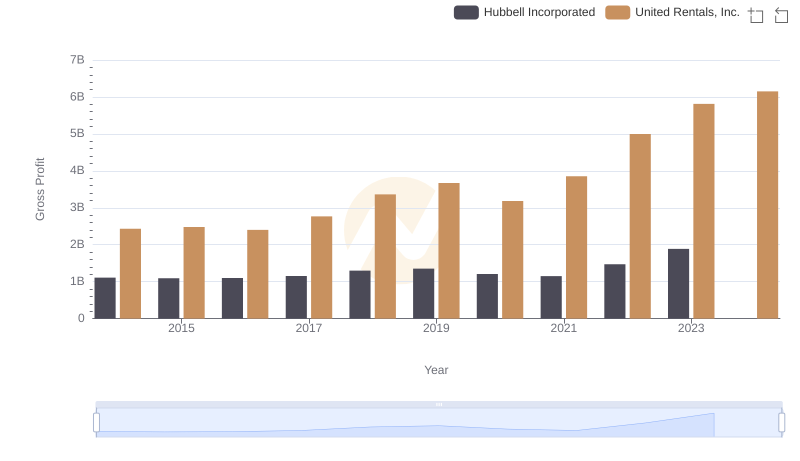
Who Generates Higher Gross Profit? United Rentals, Inc. or Hubbell Incorporated
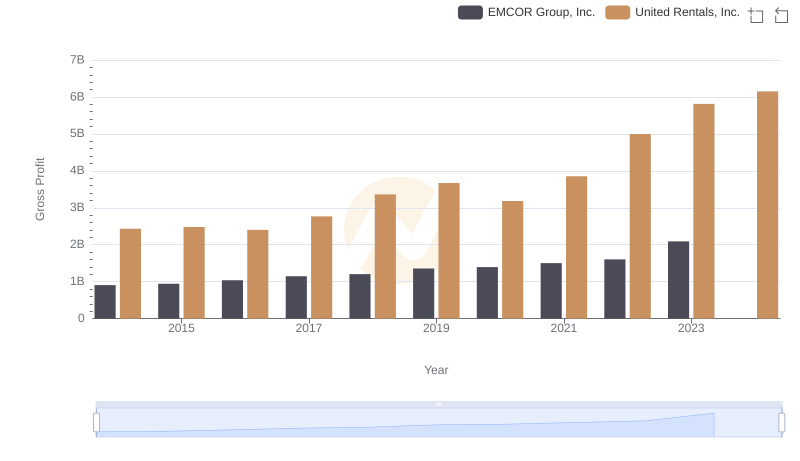
United Rentals, Inc. and EMCOR Group, Inc.: A Detailed Gross Profit Analysis
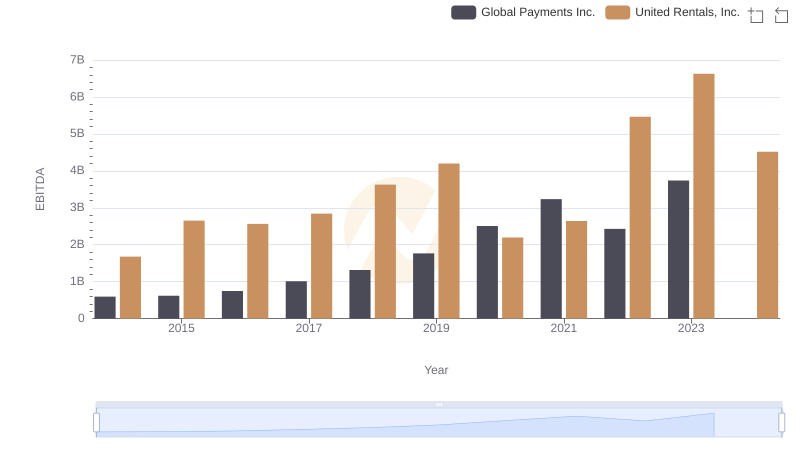
A Side-by-Side Analysis of EBITDA: United Rentals, Inc. and Global Payments Inc.