| __timestamp | Dover Corporation | United Rentals, Inc. |
|---|---|---|
| Wednesday, January 1, 2014 | 4778479000 | 3253000000 |
| Thursday, January 1, 2015 | 4388167000 | 3337000000 |
| Friday, January 1, 2016 | 4322373000 | 3359000000 |
| Sunday, January 1, 2017 | 4940059000 | 3872000000 |
| Monday, January 1, 2018 | 4432562000 | 4683000000 |
| Tuesday, January 1, 2019 | 4515459000 | 5681000000 |
| Wednesday, January 1, 2020 | 4209741000 | 5347000000 |
| Friday, January 1, 2021 | 4937295000 | 5863000000 |
| Saturday, January 1, 2022 | 5444532000 | 6646000000 |
| Sunday, January 1, 2023 | 5353501000 | 8519000000 |
| Monday, January 1, 2024 | 4787288000 | 9195000000 |
Unlocking the unknown
In the ever-evolving landscape of industrial services, understanding cost structures is pivotal. United Rentals, Inc. and Dover Corporation, two giants in their respective fields, offer a fascinating study in cost management over the past decade. From 2014 to 2023, United Rentals, Inc. has seen a remarkable 162% increase in its Cost of Revenue, peaking at $8.52 billion in 2023. In contrast, Dover Corporation's costs have grown more modestly, with a 12% rise, reaching $5.35 billion in the same year.
This divergence highlights United Rentals' aggressive expansion strategy, while Dover Corporation maintains a steady growth trajectory. Notably, 2024 data for Dover Corporation is missing, leaving room for speculation on its future cost trends. As these companies navigate the complexities of their industries, their cost strategies will undoubtedly continue to shape their competitive positions.
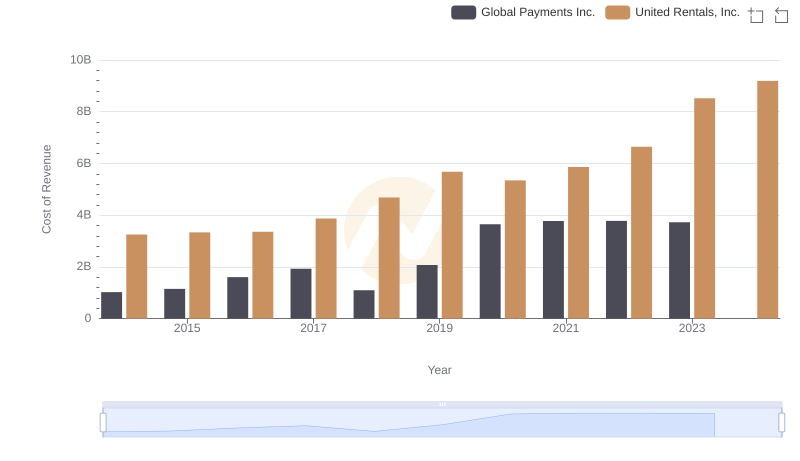
United Rentals, Inc. vs Global Payments Inc.: Efficiency in Cost of Revenue Explored
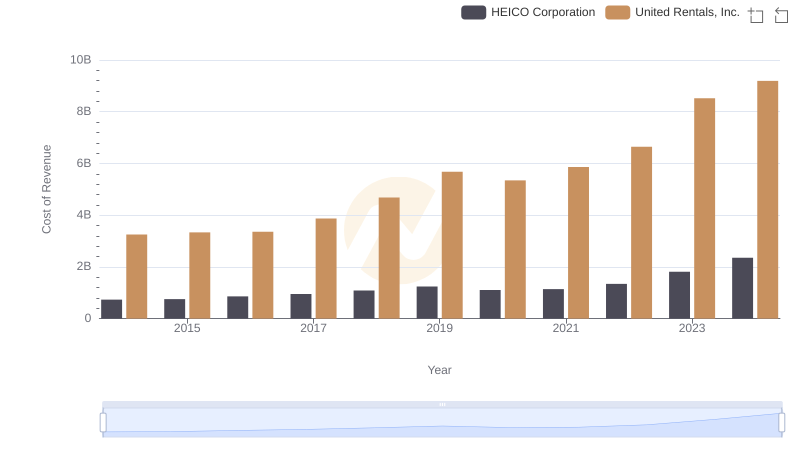
United Rentals, Inc. vs HEICO Corporation: Efficiency in Cost of Revenue Explored

United Rentals, Inc. or Dover Corporation: Who Leads in Yearly Revenue?
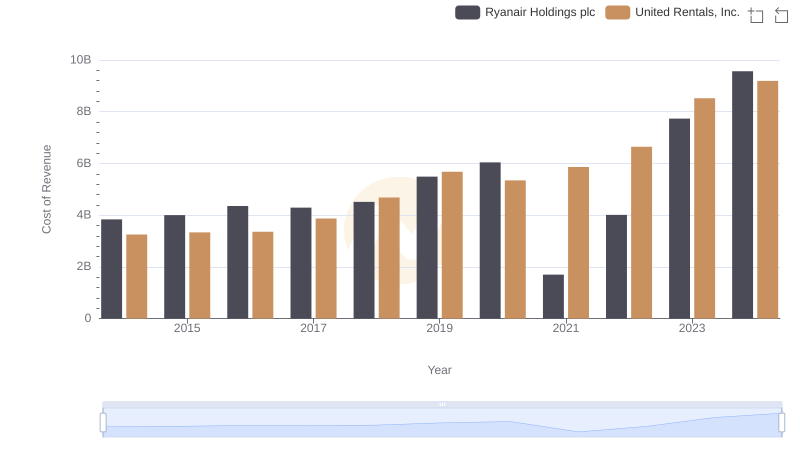
Cost Insights: Breaking Down United Rentals, Inc. and Ryanair Holdings plc's Expenses
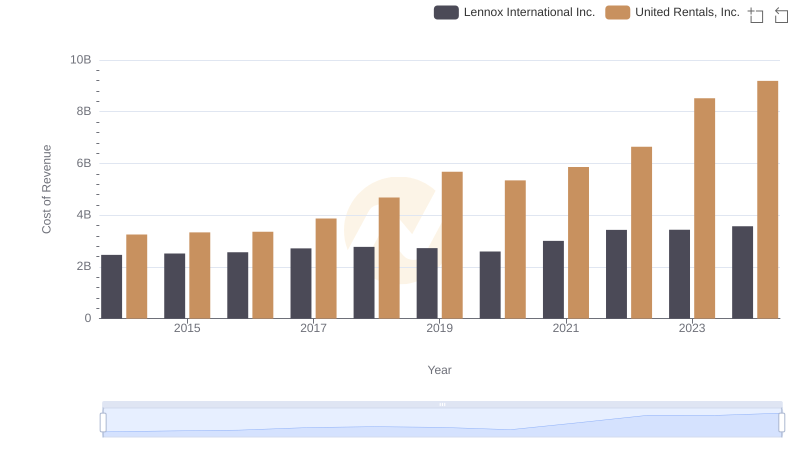
Cost of Revenue Trends: United Rentals, Inc. vs Lennox International Inc.
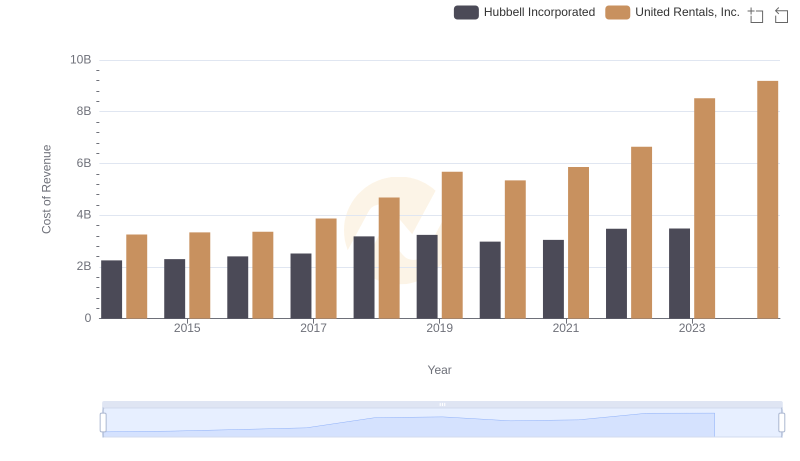
Comparing Cost of Revenue Efficiency: United Rentals, Inc. vs Hubbell Incorporated
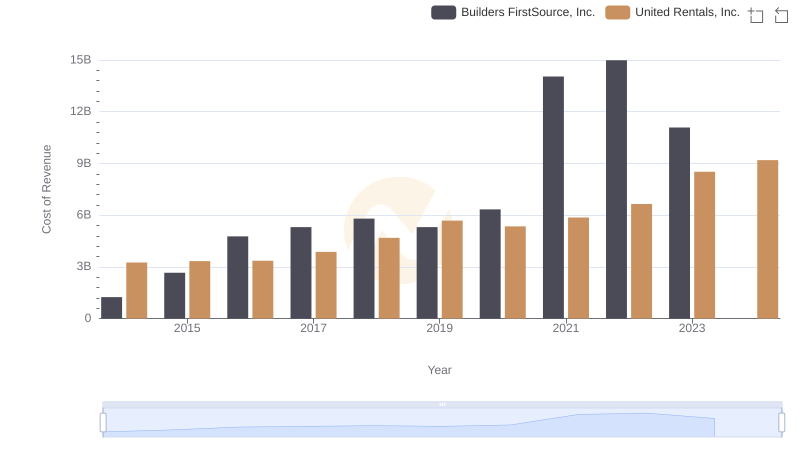
Cost Insights: Breaking Down United Rentals, Inc. and Builders FirstSource, Inc.'s Expenses
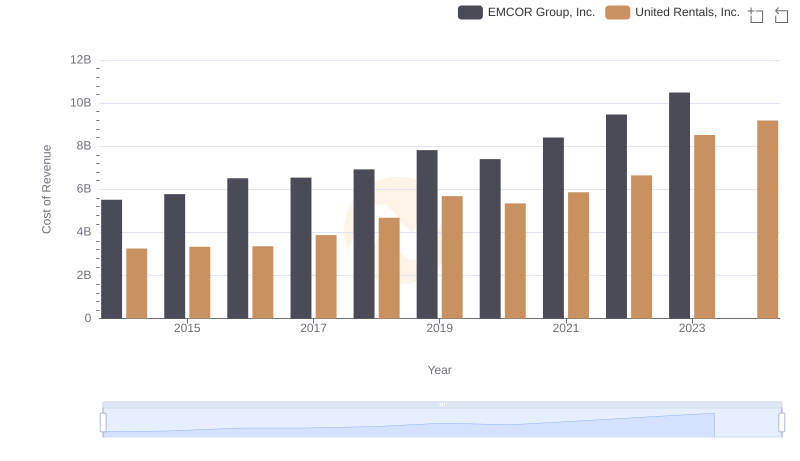
United Rentals, Inc. vs EMCOR Group, Inc.: Efficiency in Cost of Revenue Explored
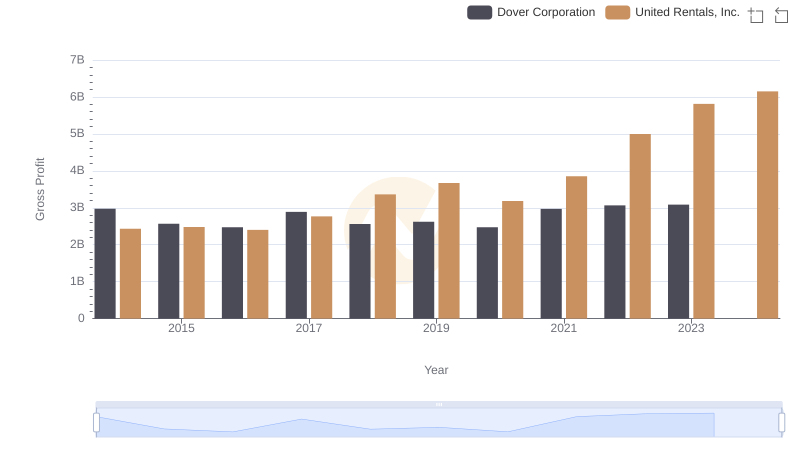
Gross Profit Trends Compared: United Rentals, Inc. vs Dover Corporation
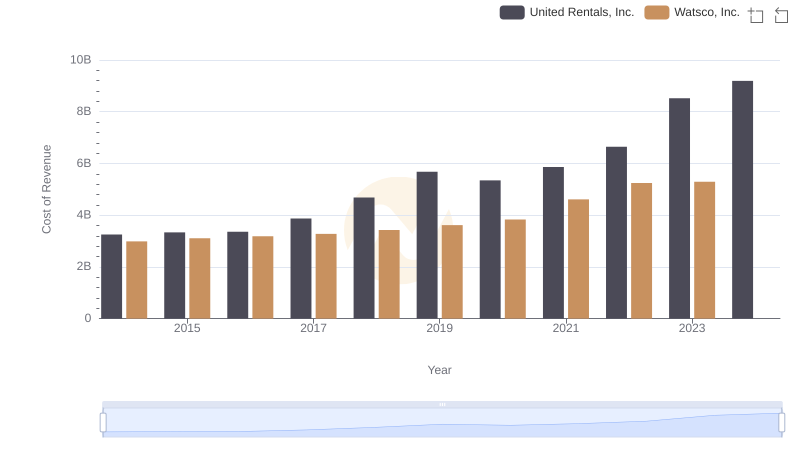
United Rentals, Inc. vs Watsco, Inc.: Efficiency in Cost of Revenue Explored
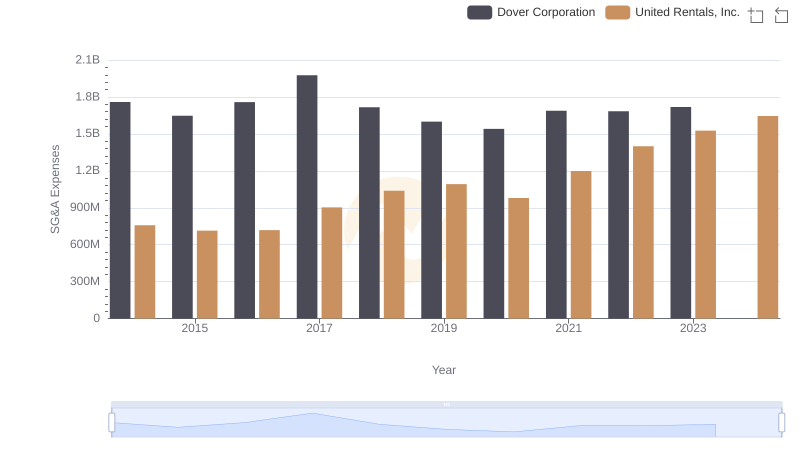
Operational Costs Compared: SG&A Analysis of United Rentals, Inc. and Dover Corporation
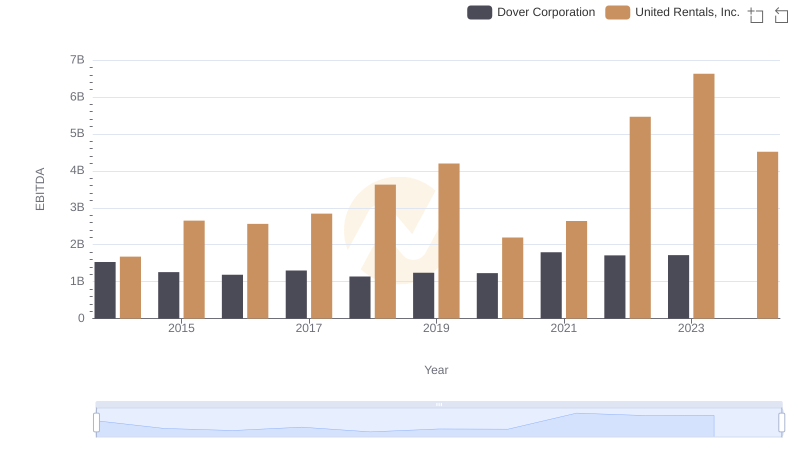
Comparative EBITDA Analysis: United Rentals, Inc. vs Dover Corporation