| __timestamp | Ryanair Holdings plc | United Rentals, Inc. |
|---|---|---|
| Wednesday, January 1, 2014 | 3838100000 | 3253000000 |
| Thursday, January 1, 2015 | 3999600000 | 3337000000 |
| Friday, January 1, 2016 | 4355900000 | 3359000000 |
| Sunday, January 1, 2017 | 4294000000 | 3872000000 |
| Monday, January 1, 2018 | 4512300000 | 4683000000 |
| Tuesday, January 1, 2019 | 5492800000 | 5681000000 |
| Wednesday, January 1, 2020 | 6039900000 | 5347000000 |
| Friday, January 1, 2021 | 1702700000 | 5863000000 |
| Saturday, January 1, 2022 | 4009800000 | 6646000000 |
| Sunday, January 1, 2023 | 7735000000 | 8519000000 |
| Monday, January 1, 2024 | 9566400000 | 9195000000 |
Data in motion
In the ever-evolving landscape of global business, understanding cost structures is pivotal. United Rentals, Inc. and Ryanair Holdings plc, two giants in their respective industries, offer a fascinating study in cost management over the past decade. From 2014 to 2024, both companies have shown significant fluctuations in their cost of revenue.
Ryanair Holdings plc: Starting at 3.8 billion in 2014, Ryanair's cost of revenue surged by approximately 150% to reach 9.6 billion by 2024. This dramatic increase reflects the airline's aggressive expansion and operational challenges.
United Rentals, Inc.: With a more stable trajectory, United Rentals saw a 180% increase from 3.3 billion in 2014 to 9.2 billion in 2024. This growth underscores the company's strategic investments in equipment and services.
These insights highlight the dynamic nature of cost management in different sectors, offering valuable lessons for businesses worldwide.
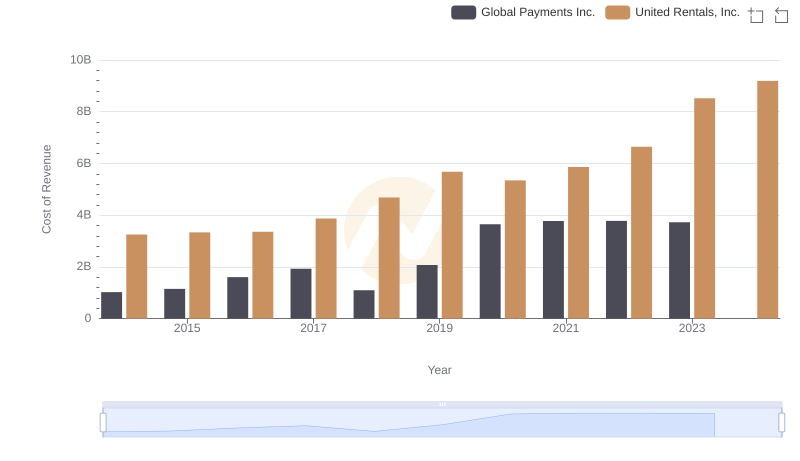
United Rentals, Inc. vs Global Payments Inc.: Efficiency in Cost of Revenue Explored
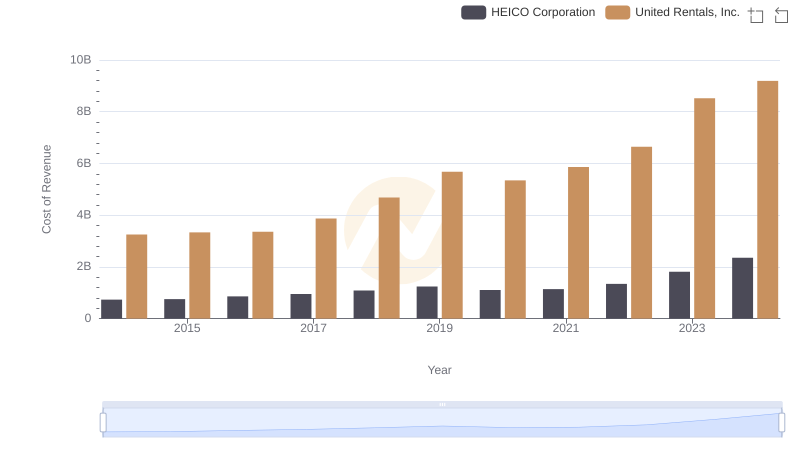
United Rentals, Inc. vs HEICO Corporation: Efficiency in Cost of Revenue Explored
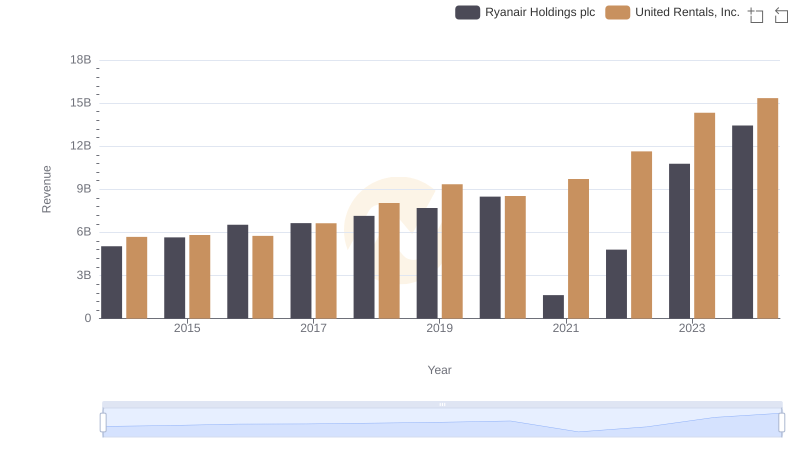
Revenue Insights: United Rentals, Inc. and Ryanair Holdings plc Performance Compared
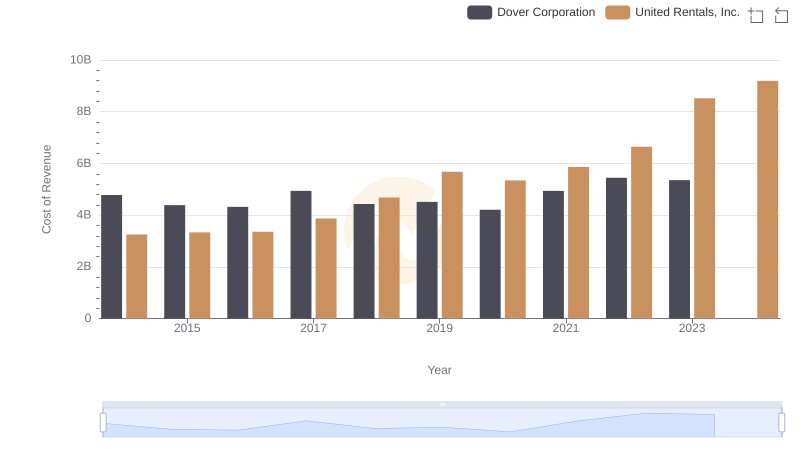
Cost Insights: Breaking Down United Rentals, Inc. and Dover Corporation's Expenses
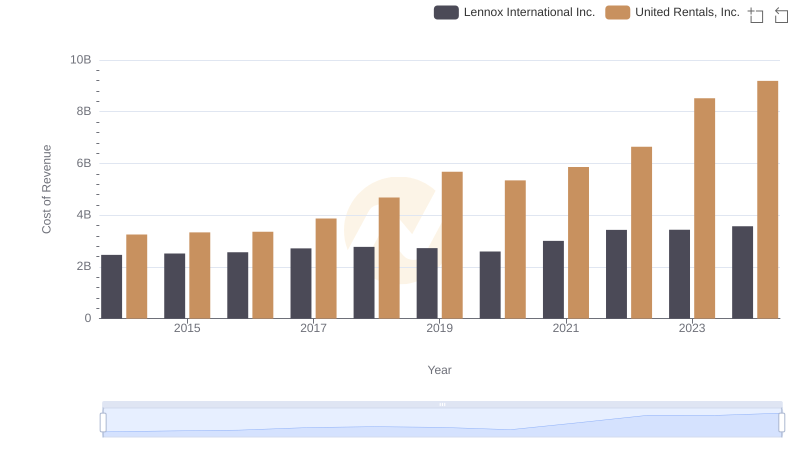
Cost of Revenue Trends: United Rentals, Inc. vs Lennox International Inc.
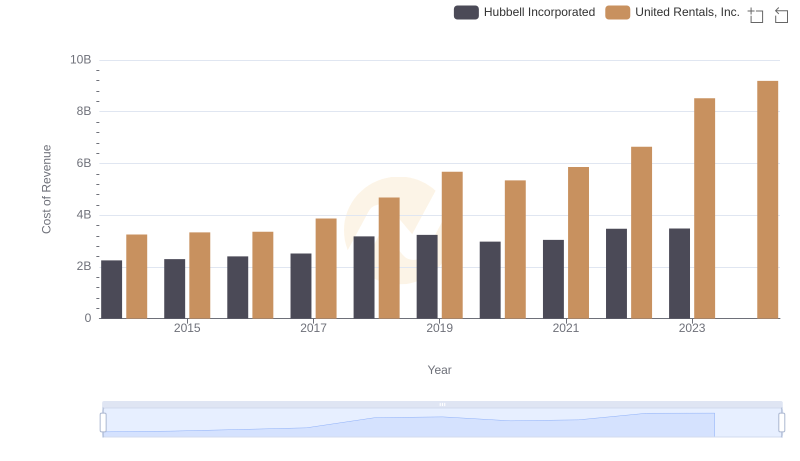
Comparing Cost of Revenue Efficiency: United Rentals, Inc. vs Hubbell Incorporated
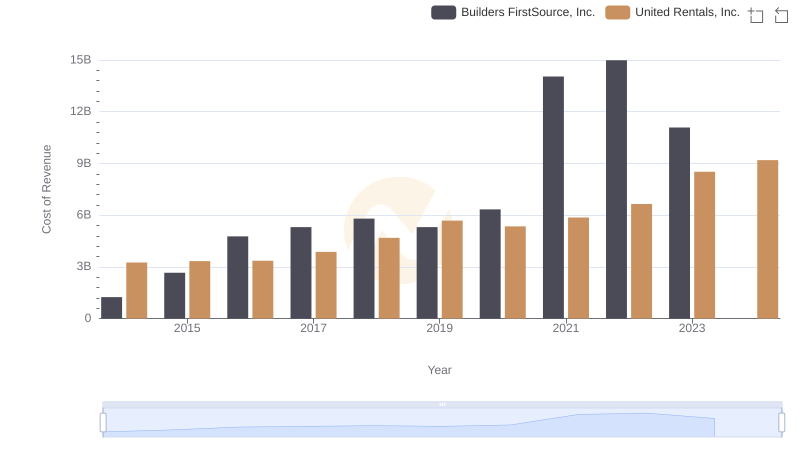
Cost Insights: Breaking Down United Rentals, Inc. and Builders FirstSource, Inc.'s Expenses
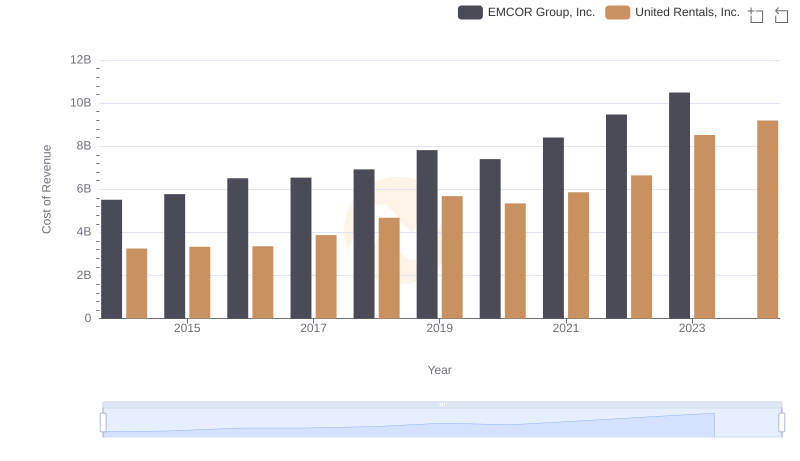
United Rentals, Inc. vs EMCOR Group, Inc.: Efficiency in Cost of Revenue Explored
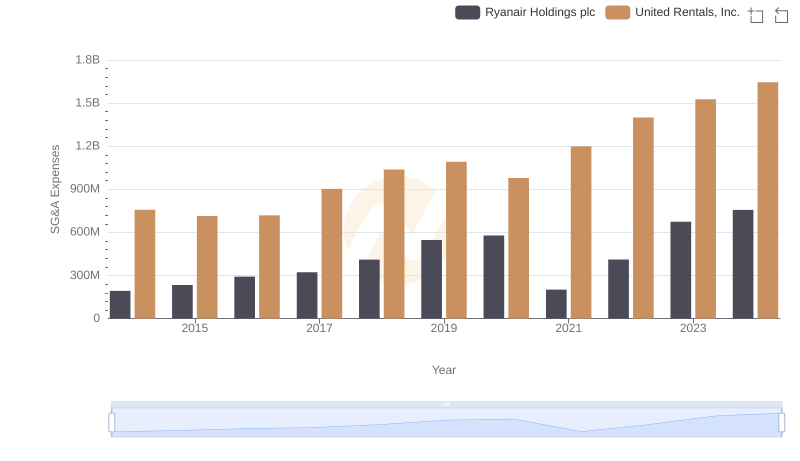
Breaking Down SG&A Expenses: United Rentals, Inc. vs Ryanair Holdings plc
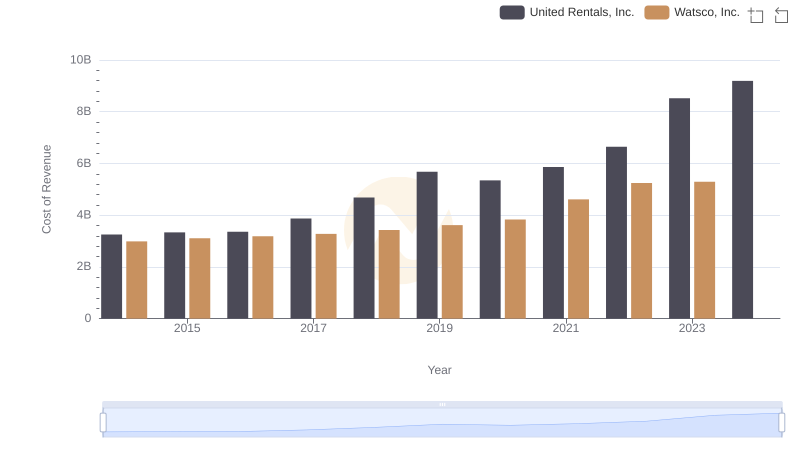
United Rentals, Inc. vs Watsco, Inc.: Efficiency in Cost of Revenue Explored
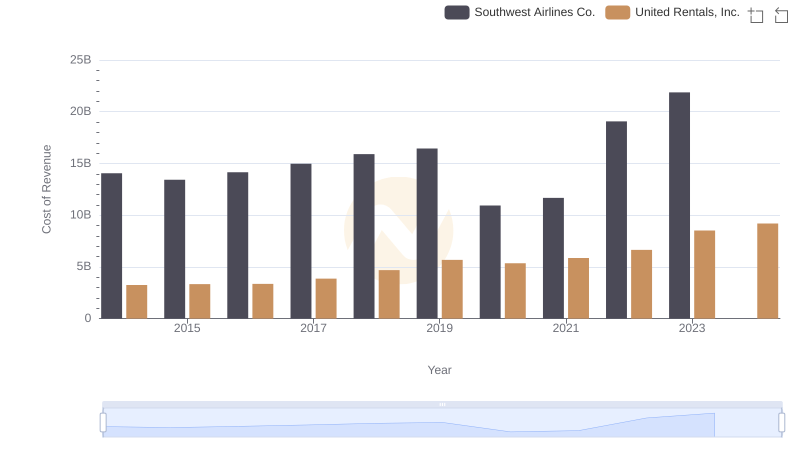
Cost Insights: Breaking Down United Rentals, Inc. and Southwest Airlines Co.'s Expenses
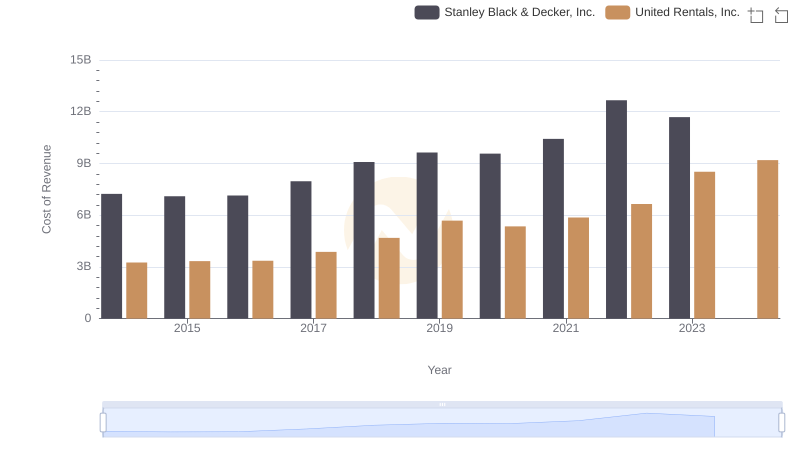
Cost of Revenue Comparison: United Rentals, Inc. vs Stanley Black & Decker, Inc.