| __timestamp | United Rentals, Inc. | Xylem Inc. |
|---|---|---|
| Wednesday, January 1, 2014 | 3253000000 | 2403000000 |
| Thursday, January 1, 2015 | 3337000000 | 2249000000 |
| Friday, January 1, 2016 | 3359000000 | 2310000000 |
| Sunday, January 1, 2017 | 3872000000 | 2856000000 |
| Monday, January 1, 2018 | 4683000000 | 3181000000 |
| Tuesday, January 1, 2019 | 5681000000 | 3203000000 |
| Wednesday, January 1, 2020 | 5347000000 | 3046000000 |
| Friday, January 1, 2021 | 5863000000 | 3220000000 |
| Saturday, January 1, 2022 | 6646000000 | 3438000000 |
| Sunday, January 1, 2023 | 8519000000 | 4647000000 |
| Monday, January 1, 2024 | 9195000000 |
Unleashing insights
In the competitive landscape of industrial services and water technology, United Rentals, Inc. and Xylem Inc. have carved out significant niches. Over the past decade, United Rentals has consistently outpaced Xylem in terms of cost of revenue, reflecting its expansive operations and market reach. From 2014 to 2023, United Rentals saw a staggering 183% increase in its cost of revenue, peaking in 2023. In contrast, Xylem's cost of revenue grew by approximately 93% over the same period, highlighting its steady yet more modest growth trajectory. Notably, 2023 marked a significant year for both companies, with United Rentals reaching its highest recorded cost of revenue, while Xylem also experienced a notable increase. However, data for 2024 is incomplete, leaving room for speculation on future trends. This comparison underscores the dynamic nature of these industries and the strategic maneuvers companies must make to maintain their competitive edge.
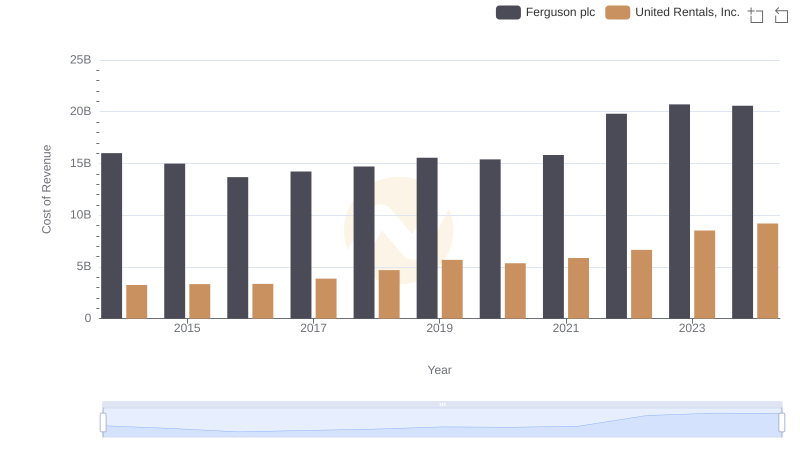
Cost of Revenue Comparison: United Rentals, Inc. vs Ferguson plc
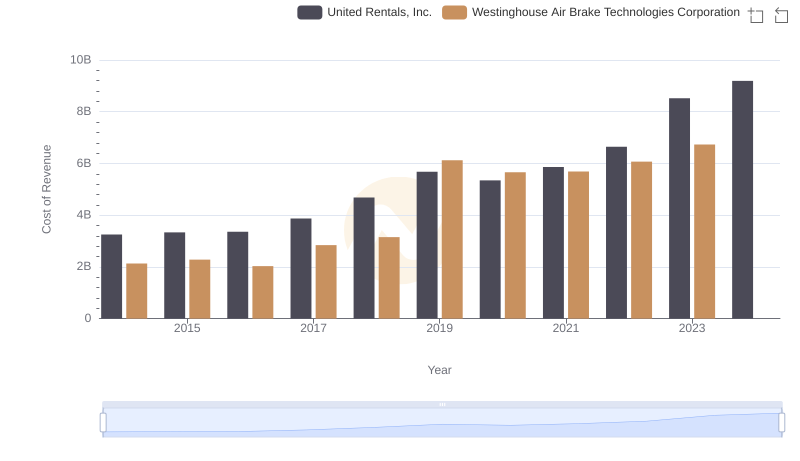
United Rentals, Inc. vs Westinghouse Air Brake Technologies Corporation: Efficiency in Cost of Revenue Explored
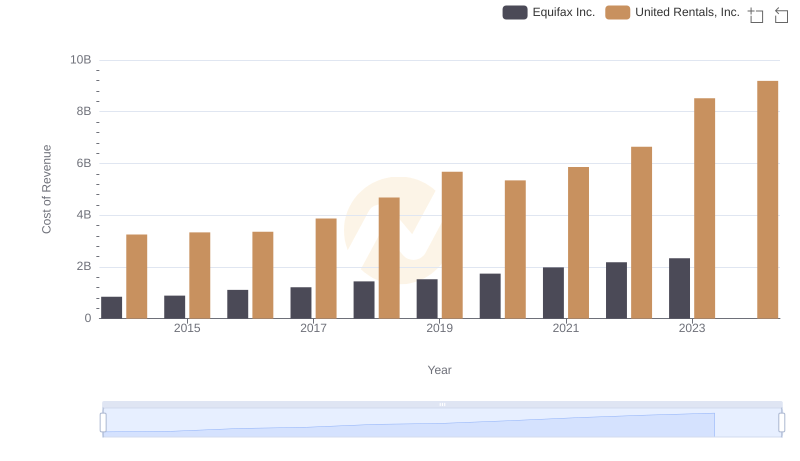
United Rentals, Inc. vs Equifax Inc.: Efficiency in Cost of Revenue Explored
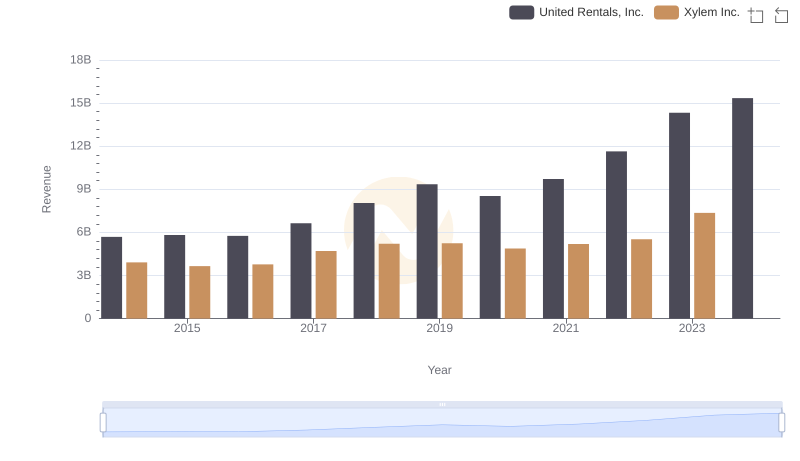
United Rentals, Inc. vs Xylem Inc.: Examining Key Revenue Metrics
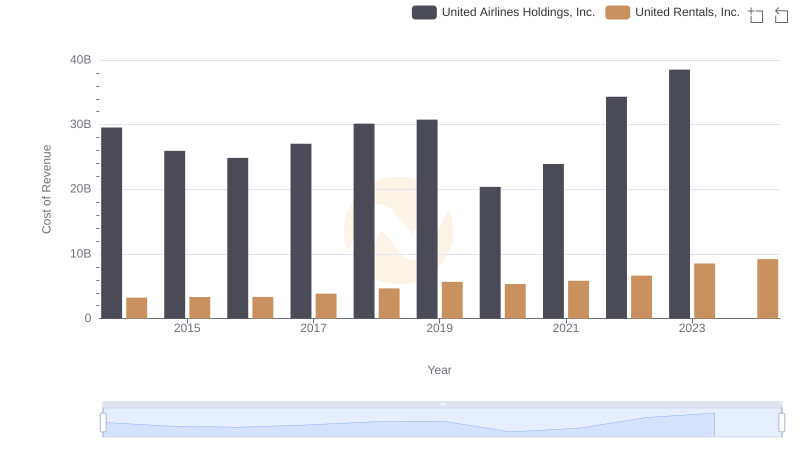
Cost Insights: Breaking Down United Rentals, Inc. and United Airlines Holdings, Inc.'s Expenses
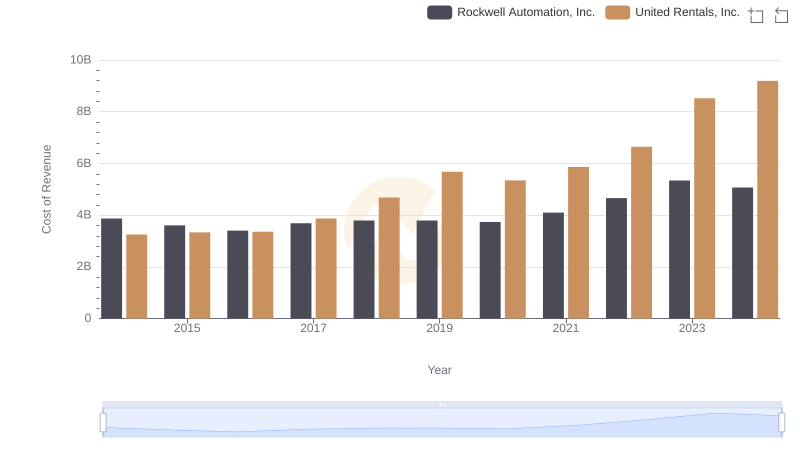
Cost of Revenue Comparison: United Rentals, Inc. vs Rockwell Automation, Inc.
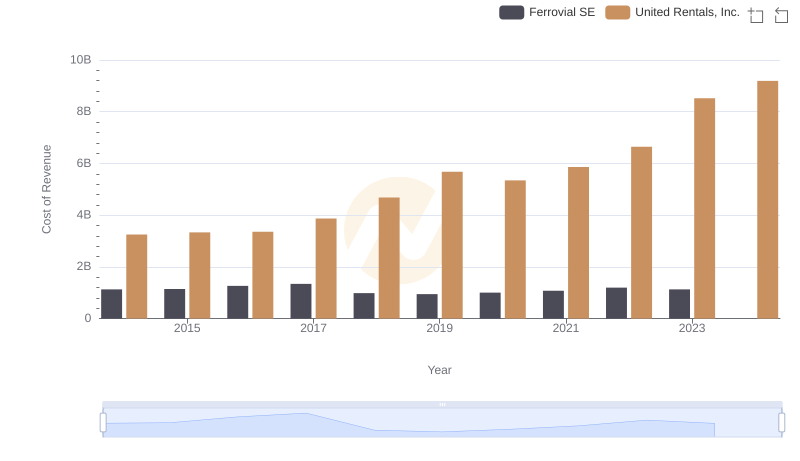
Analyzing Cost of Revenue: United Rentals, Inc. and Ferrovial SE
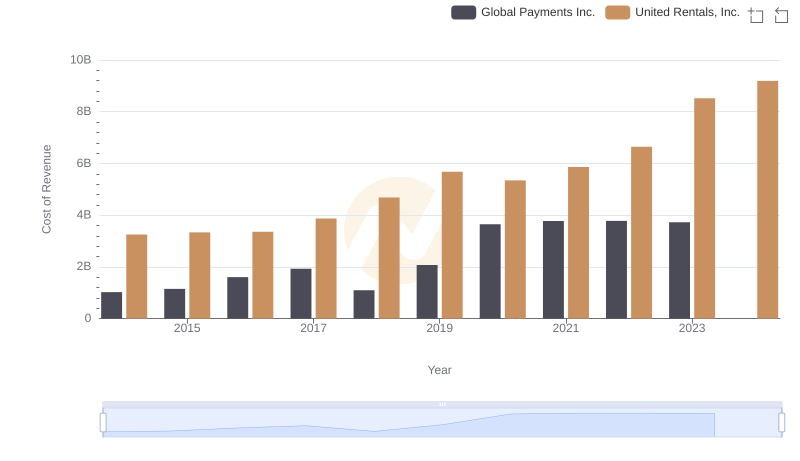
United Rentals, Inc. vs Global Payments Inc.: Efficiency in Cost of Revenue Explored
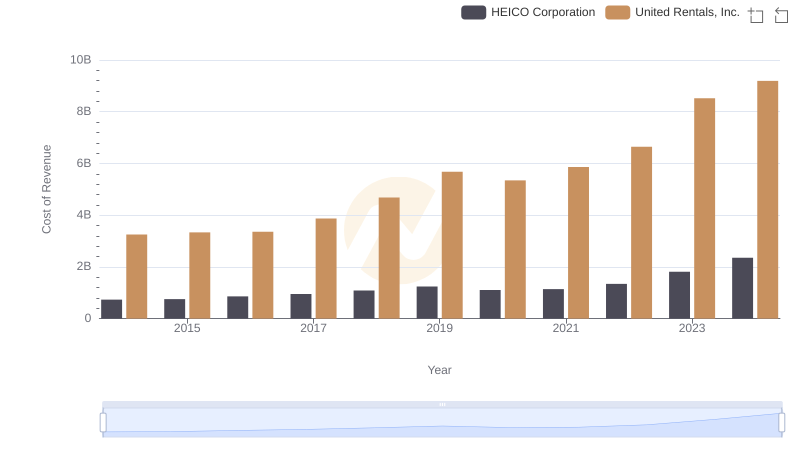
United Rentals, Inc. vs HEICO Corporation: Efficiency in Cost of Revenue Explored

Gross Profit Comparison: United Rentals, Inc. and Xylem Inc. Trends
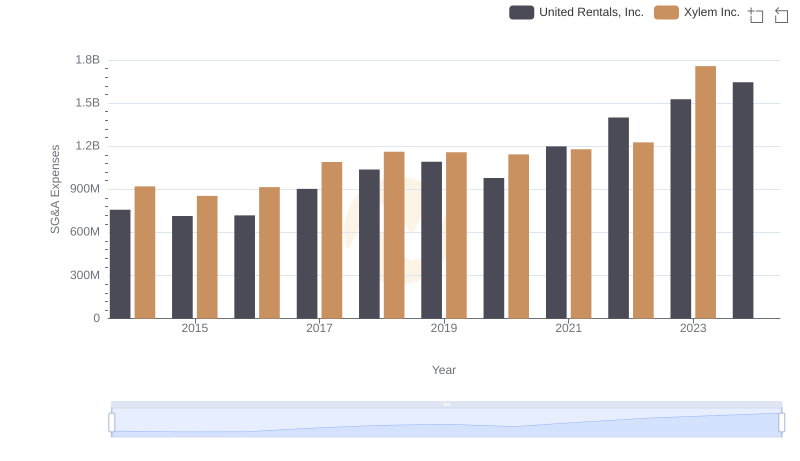
United Rentals, Inc. and Xylem Inc.: SG&A Spending Patterns Compared
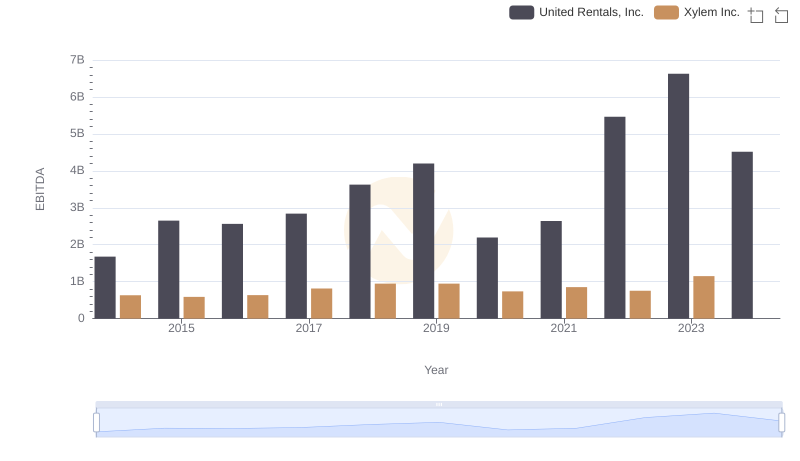
A Side-by-Side Analysis of EBITDA: United Rentals, Inc. and Xylem Inc.