| __timestamp | HEICO Corporation | United Rentals, Inc. |
|---|---|---|
| Wednesday, January 1, 2014 | 733999000 | 3253000000 |
| Thursday, January 1, 2015 | 754469000 | 3337000000 |
| Friday, January 1, 2016 | 860766000 | 3359000000 |
| Sunday, January 1, 2017 | 950088000 | 3872000000 |
| Monday, January 1, 2018 | 1087006000 | 4683000000 |
| Tuesday, January 1, 2019 | 1241807000 | 5681000000 |
| Wednesday, January 1, 2020 | 1104882000 | 5347000000 |
| Friday, January 1, 2021 | 1138259000 | 5863000000 |
| Saturday, January 1, 2022 | 1345563000 | 6646000000 |
| Sunday, January 1, 2023 | 1814617000 | 8519000000 |
| Monday, January 1, 2024 | 2355943000 | 9195000000 |
Data in motion
In the ever-evolving landscape of industrial services and aerospace technology, understanding cost efficiency is paramount. This analysis delves into the cost of revenue trends for United Rentals, Inc. and HEICO Corporation from 2014 to 2024. Over this decade, United Rentals, Inc. has consistently outpaced HEICO Corporation, with its cost of revenue growing by approximately 183%, compared to HEICO's 221% increase.
United Rentals, Inc. started with a cost of revenue of $3.25 billion in 2014, reaching $9.19 billion by 2024. Meanwhile, HEICO Corporation's cost of revenue rose from $734 million to $2.36 billion. This growth reflects the companies' strategic expansions and market adaptations.
Despite the higher absolute figures for United Rentals, Inc., HEICO Corporation's relative growth suggests a robust strategy in managing costs while scaling operations. This comparison offers valuable insights into the efficiency dynamics within these industries.
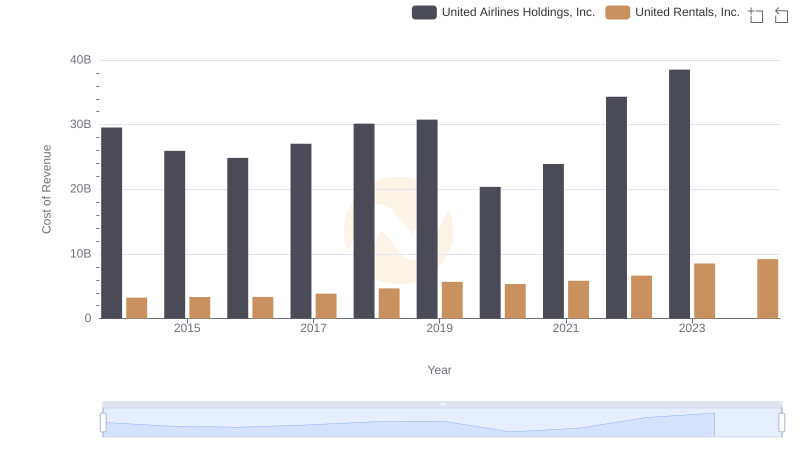
Cost Insights: Breaking Down United Rentals, Inc. and United Airlines Holdings, Inc.'s Expenses
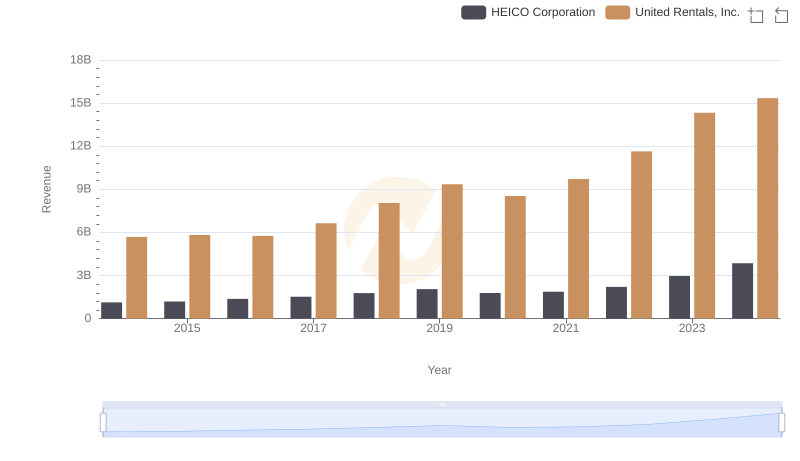
Who Generates More Revenue? United Rentals, Inc. or HEICO Corporation
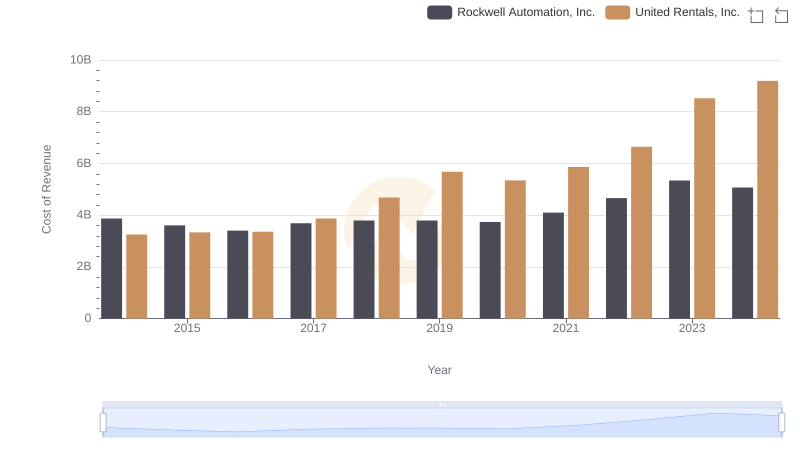
Cost of Revenue Comparison: United Rentals, Inc. vs Rockwell Automation, Inc.
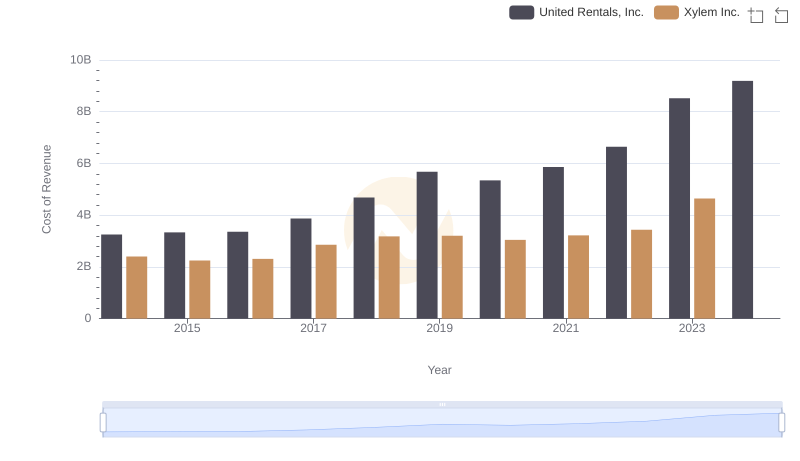
Cost of Revenue Comparison: United Rentals, Inc. vs Xylem Inc.
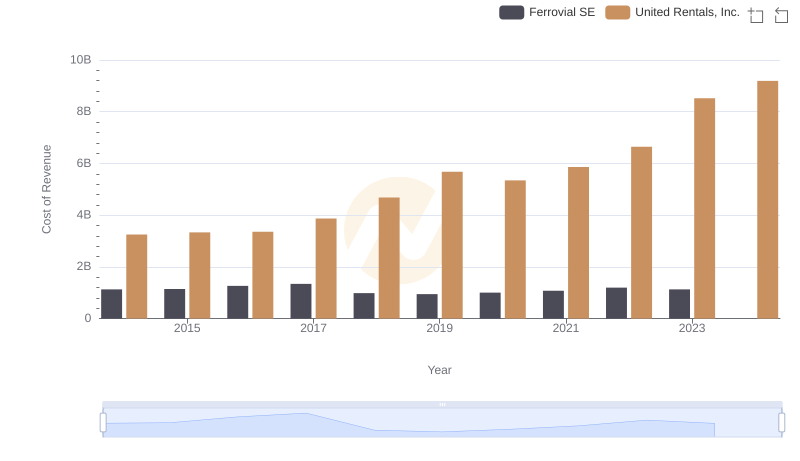
Analyzing Cost of Revenue: United Rentals, Inc. and Ferrovial SE
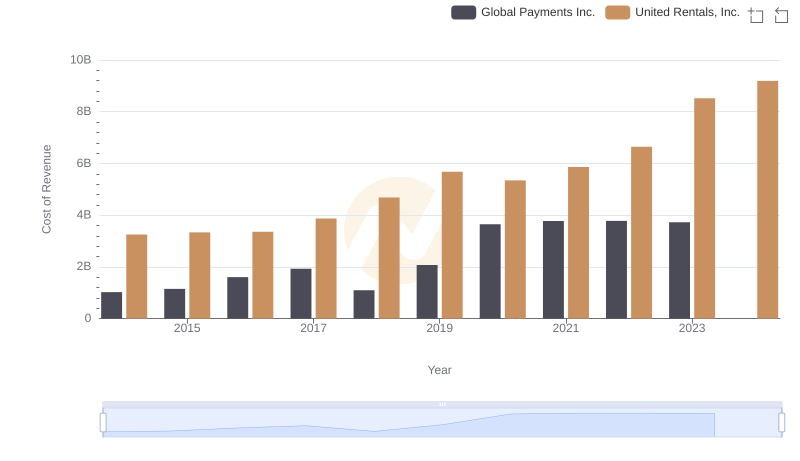
United Rentals, Inc. vs Global Payments Inc.: Efficiency in Cost of Revenue Explored
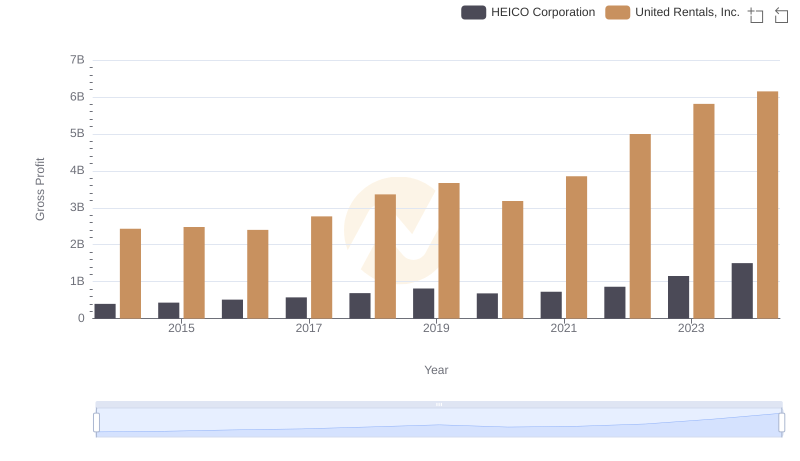
Who Generates Higher Gross Profit? United Rentals, Inc. or HEICO Corporation
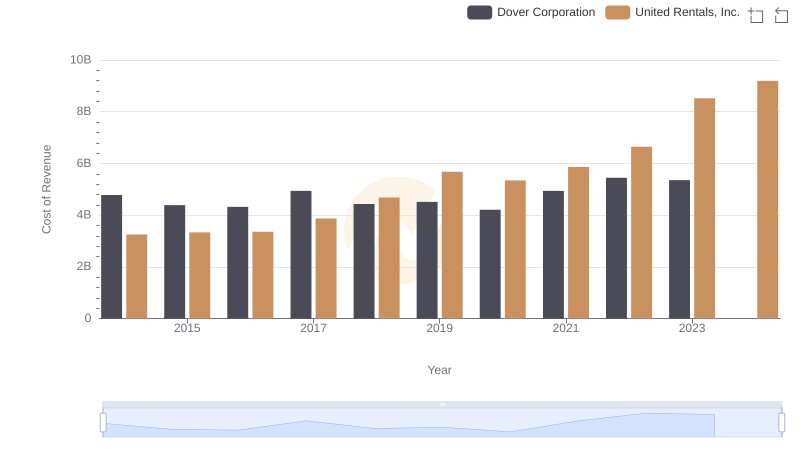
Cost Insights: Breaking Down United Rentals, Inc. and Dover Corporation's Expenses
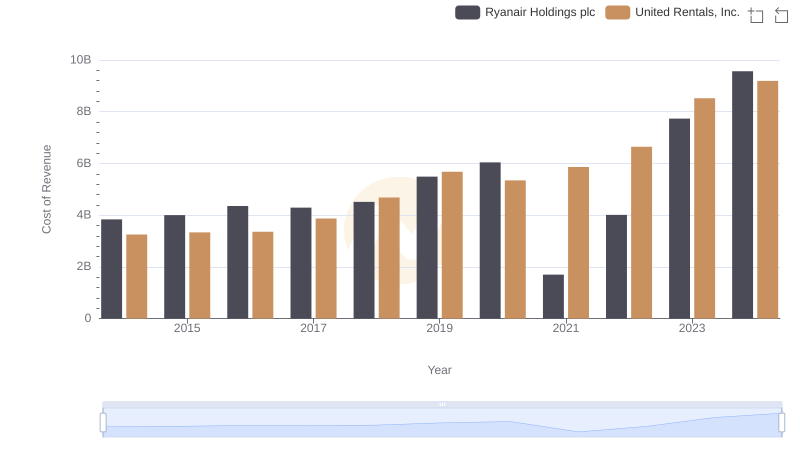
Cost Insights: Breaking Down United Rentals, Inc. and Ryanair Holdings plc's Expenses
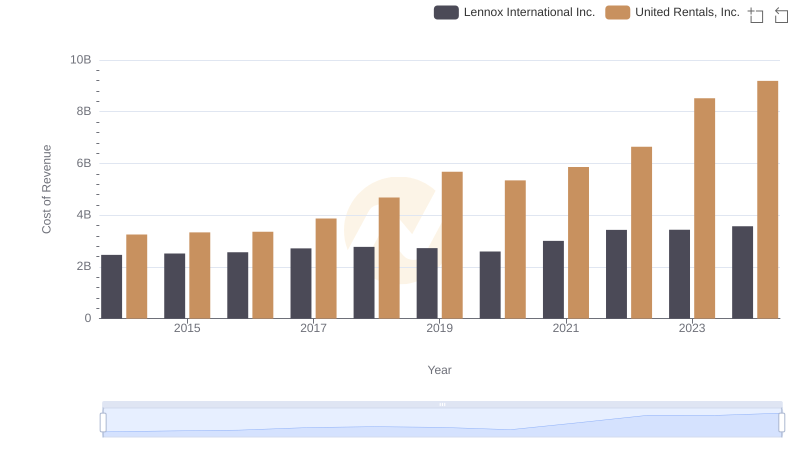
Cost of Revenue Trends: United Rentals, Inc. vs Lennox International Inc.
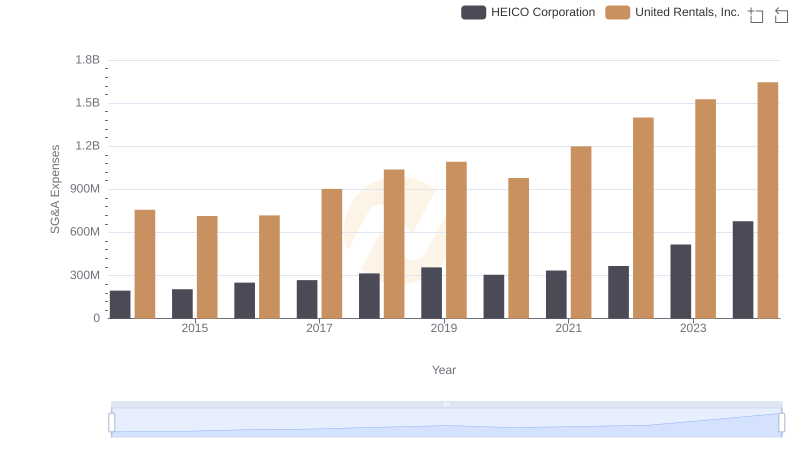
United Rentals, Inc. vs HEICO Corporation: SG&A Expense Trends
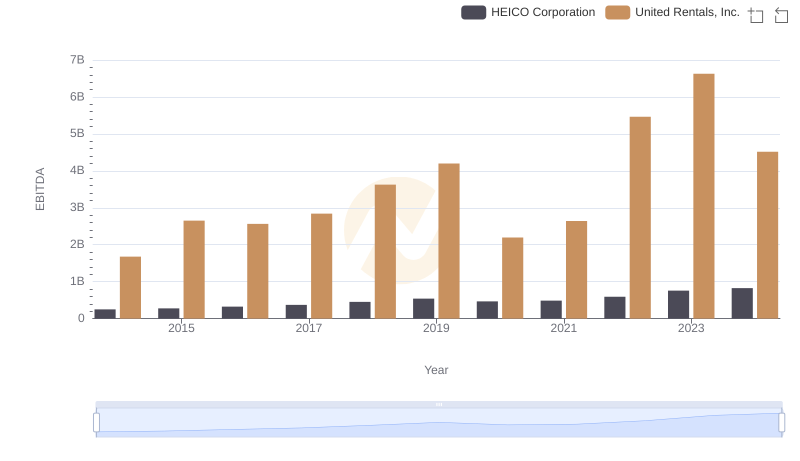
United Rentals, Inc. vs HEICO Corporation: In-Depth EBITDA Performance Comparison