| __timestamp | Global Payments Inc. | United Rentals, Inc. |
|---|---|---|
| Wednesday, January 1, 2014 | 1295014000 | 758000000 |
| Thursday, January 1, 2015 | 1325567000 | 714000000 |
| Friday, January 1, 2016 | 1411096000 | 719000000 |
| Sunday, January 1, 2017 | 1488258000 | 903000000 |
| Monday, January 1, 2018 | 1534297000 | 1038000000 |
| Tuesday, January 1, 2019 | 2046672000 | 1092000000 |
| Wednesday, January 1, 2020 | 2878878000 | 979000000 |
| Friday, January 1, 2021 | 3391161000 | 1199000000 |
| Saturday, January 1, 2022 | 3524578000 | 1400000000 |
| Sunday, January 1, 2023 | 4073768000 | 1527000000 |
| Monday, January 1, 2024 | 4285307000 | 1645000000 |
Infusing magic into the data realm
In the ever-evolving landscape of corporate finance, understanding the spending patterns of industry leaders can offer invaluable insights. Over the past decade, Global Payments Inc. and United Rentals, Inc. have showcased distinct trajectories in their Selling, General, and Administrative (SG&A) expenses. From 2014 to 2023, Global Payments Inc. saw a staggering 214% increase in SG&A expenses, peaking at approximately $4.1 billion in 2023. In contrast, United Rentals, Inc. experienced a more modest 101% rise, reaching around $1.5 billion in the same year. This divergence highlights the differing strategic priorities and operational scales of these two companies. Notably, the data for 2024 is incomplete for Global Payments Inc., suggesting a potential shift or anomaly in their financial reporting. As businesses navigate the complexities of the modern economy, these spending patterns underscore the importance of strategic financial management.
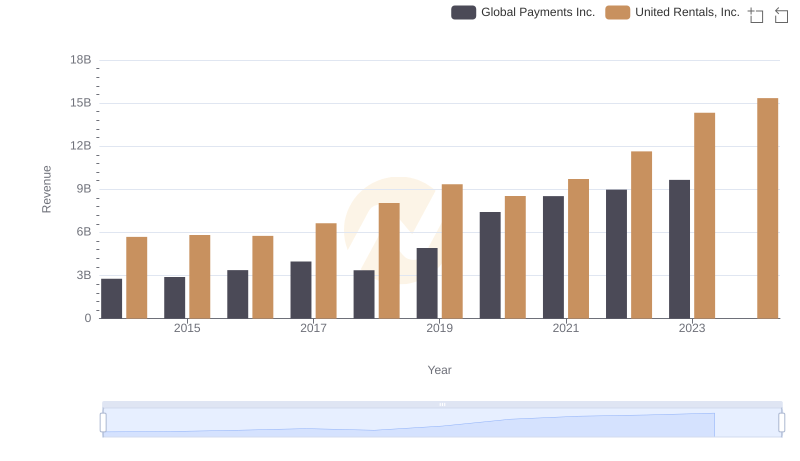
Comparing Revenue Performance: United Rentals, Inc. or Global Payments Inc.?
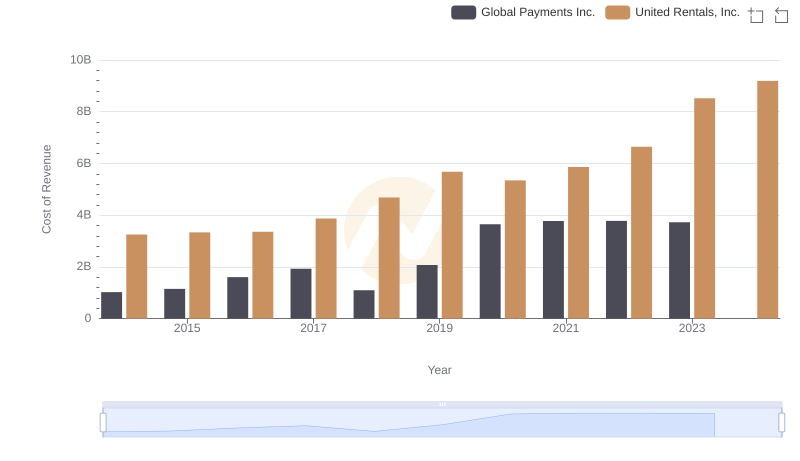
United Rentals, Inc. vs Global Payments Inc.: Efficiency in Cost of Revenue Explored
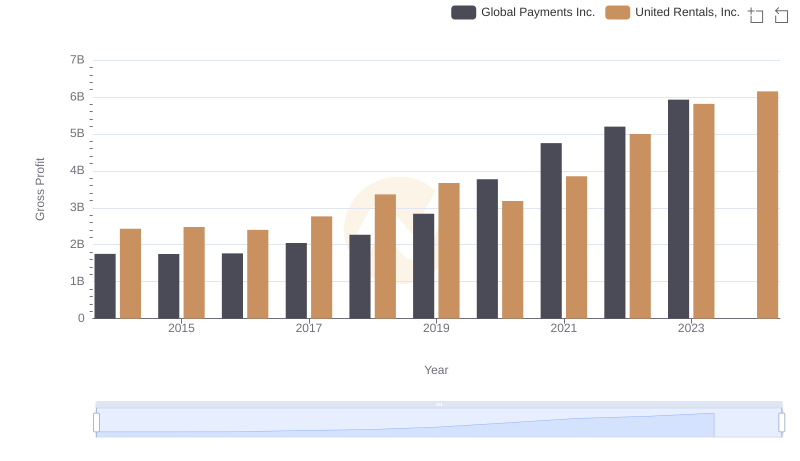
United Rentals, Inc. vs Global Payments Inc.: A Gross Profit Performance Breakdown
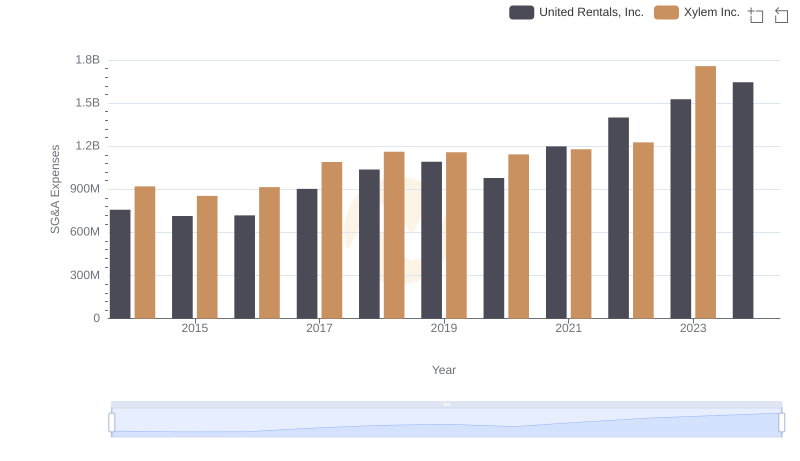
United Rentals, Inc. and Xylem Inc.: SG&A Spending Patterns Compared
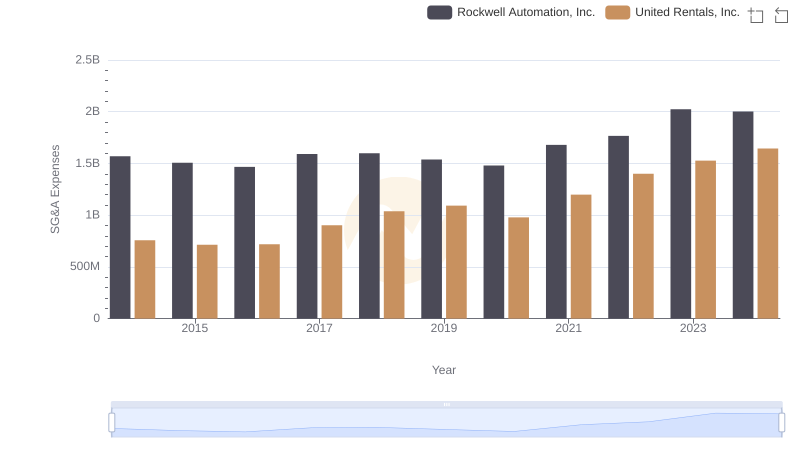
United Rentals, Inc. vs Rockwell Automation, Inc.: SG&A Expense Trends
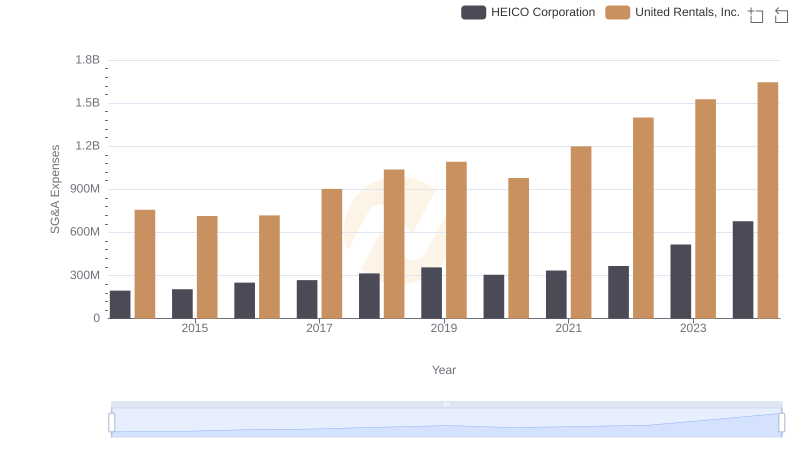
United Rentals, Inc. vs HEICO Corporation: SG&A Expense Trends
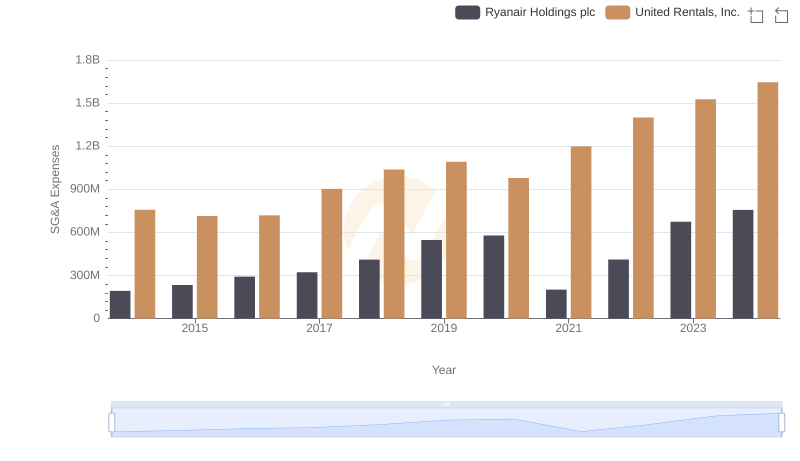
Breaking Down SG&A Expenses: United Rentals, Inc. vs Ryanair Holdings plc
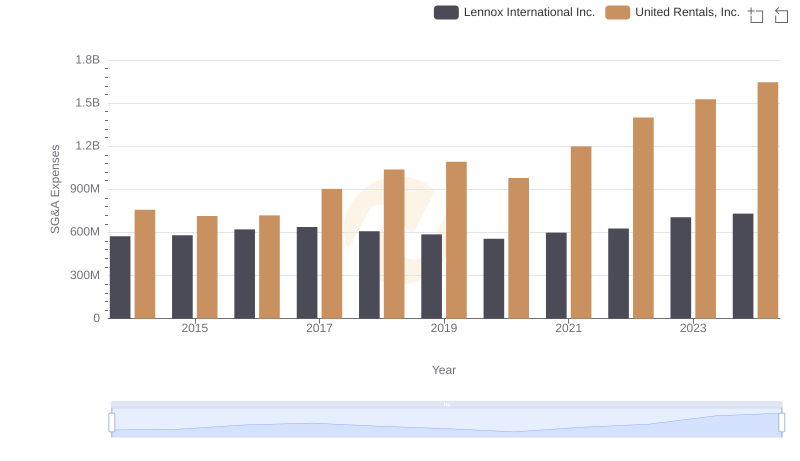
United Rentals, Inc. and Lennox International Inc.: SG&A Spending Patterns Compared
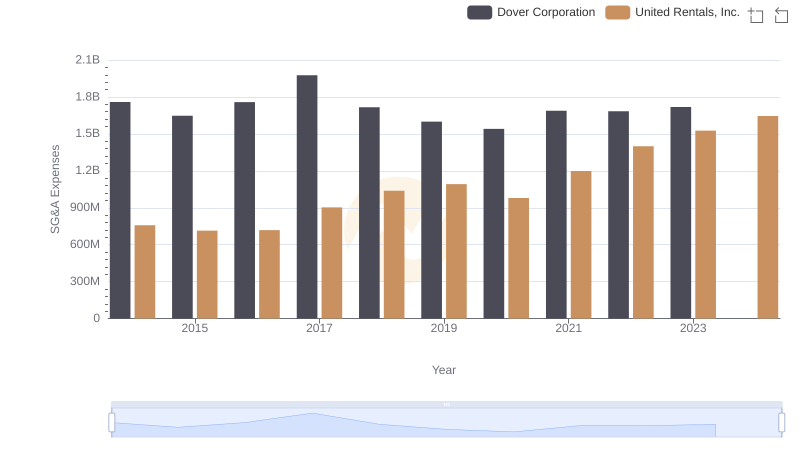
Operational Costs Compared: SG&A Analysis of United Rentals, Inc. and Dover Corporation
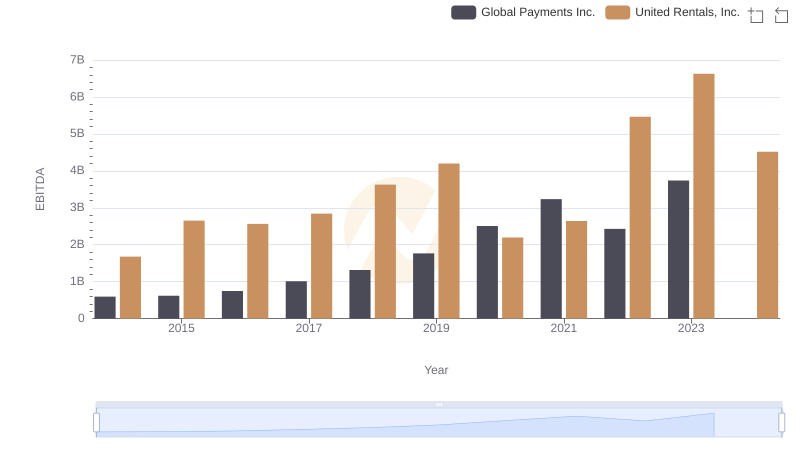
A Side-by-Side Analysis of EBITDA: United Rentals, Inc. and Global Payments Inc.
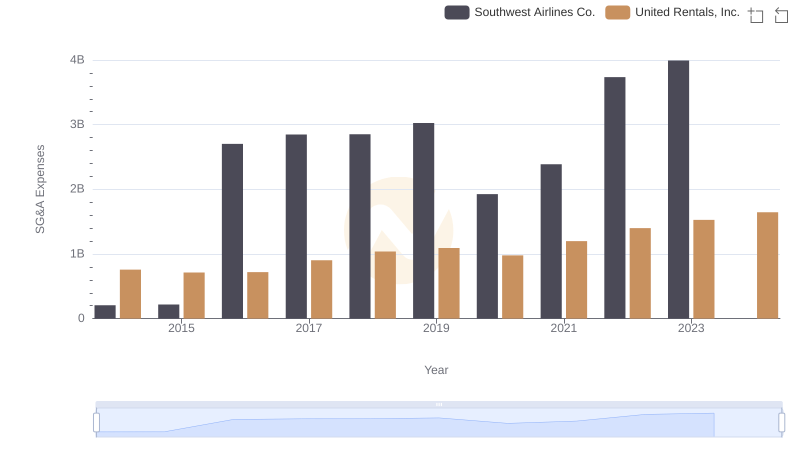
Cost Management Insights: SG&A Expenses for United Rentals, Inc. and Southwest Airlines Co.
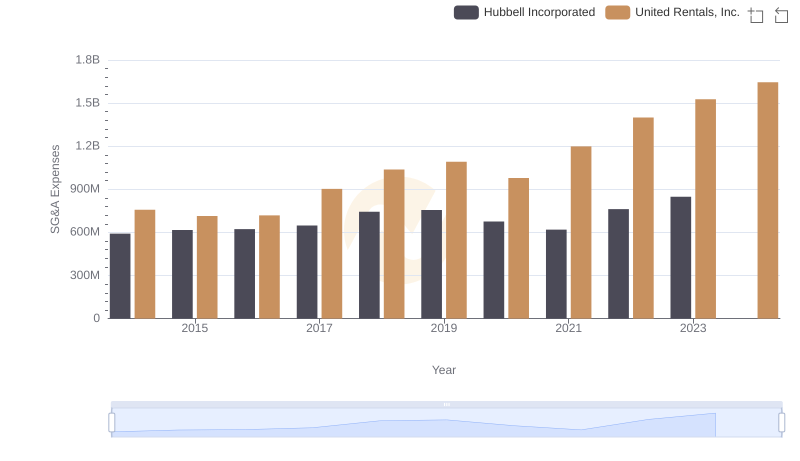
Who Optimizes SG&A Costs Better? United Rentals, Inc. or Hubbell Incorporated