| __timestamp | Global Payments Inc. | United Rentals, Inc. |
|---|---|---|
| Wednesday, January 1, 2014 | 2773718000 | 5685000000 |
| Thursday, January 1, 2015 | 2898150000 | 5817000000 |
| Friday, January 1, 2016 | 3370976000 | 5762000000 |
| Sunday, January 1, 2017 | 3975163000 | 6641000000 |
| Monday, January 1, 2018 | 3366366000 | 8047000000 |
| Tuesday, January 1, 2019 | 4911892000 | 9351000000 |
| Wednesday, January 1, 2020 | 7423558000 | 8530000000 |
| Friday, January 1, 2021 | 8523762000 | 9716000000 |
| Saturday, January 1, 2022 | 8975515000 | 11642000000 |
| Sunday, January 1, 2023 | 9654419000 | 14332000000 |
| Monday, January 1, 2024 | 10105894000 | 15345000000 |
Infusing magic into the data realm
In the ever-evolving landscape of the U.S. stock market, two giants, United Rentals, Inc. and Global Payments Inc., have showcased remarkable revenue trajectories over the past decade. From 2014 to 2023, United Rentals has consistently outpaced Global Payments, with a staggering 152% increase in revenue, reaching approximately $14.3 billion in 2023. In contrast, Global Payments has seen a robust 248% growth, culminating in nearly $9.7 billion in the same year.
United Rentals, a leader in equipment rental, has capitalized on the construction boom, while Global Payments has thrived in the digital payment revolution. Notably, 2020 marked a pivotal year for both, with Global Payments experiencing a 51% surge, reflecting the pandemic-driven shift to digital transactions. As we look to 2024, United Rentals continues its upward trajectory, though data for Global Payments remains elusive.
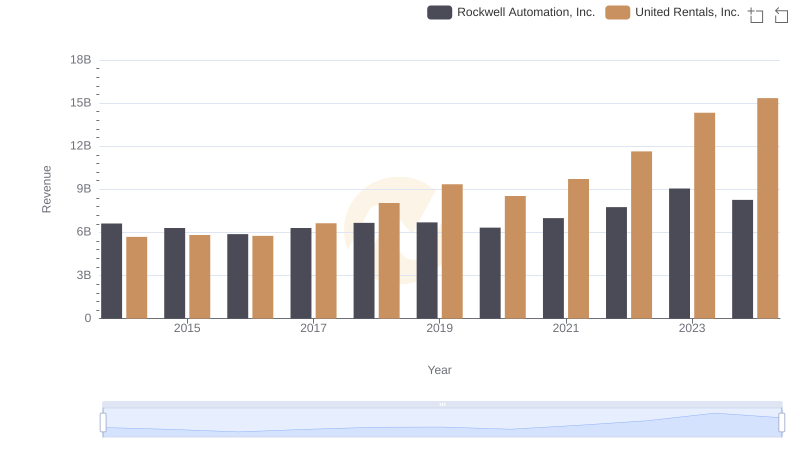
Annual Revenue Comparison: United Rentals, Inc. vs Rockwell Automation, Inc.
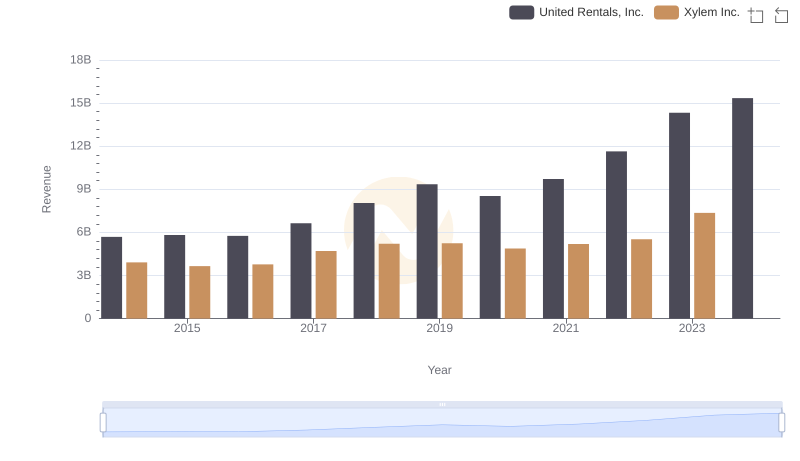
United Rentals, Inc. vs Xylem Inc.: Examining Key Revenue Metrics
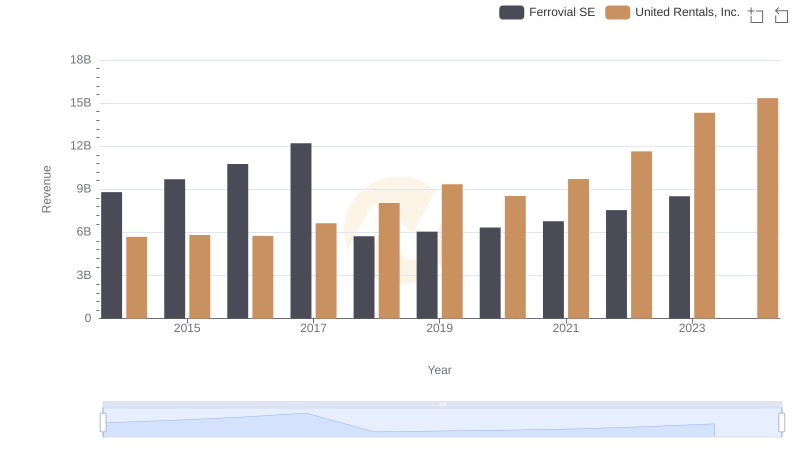
United Rentals, Inc. or Ferrovial SE: Who Leads in Yearly Revenue?
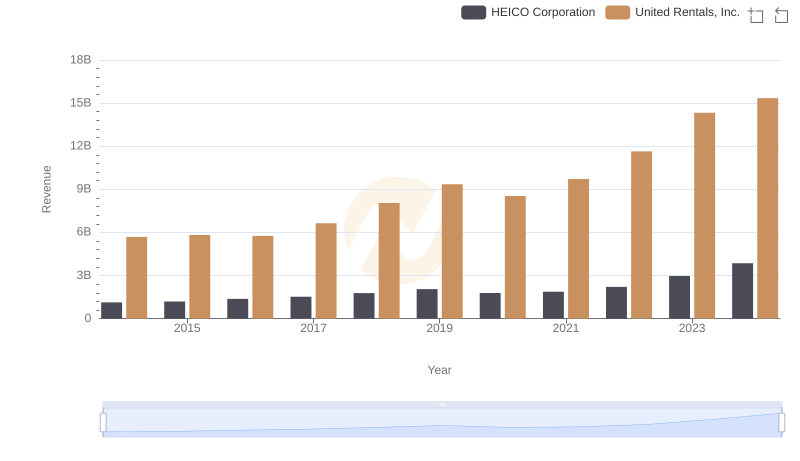
Who Generates More Revenue? United Rentals, Inc. or HEICO Corporation
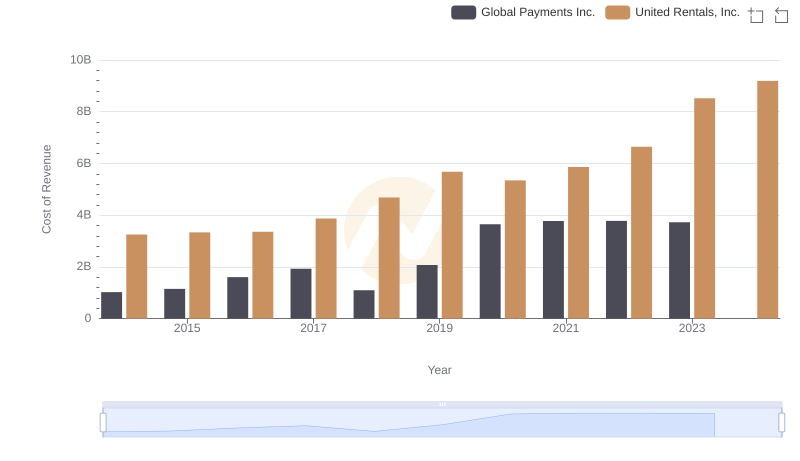
United Rentals, Inc. vs Global Payments Inc.: Efficiency in Cost of Revenue Explored
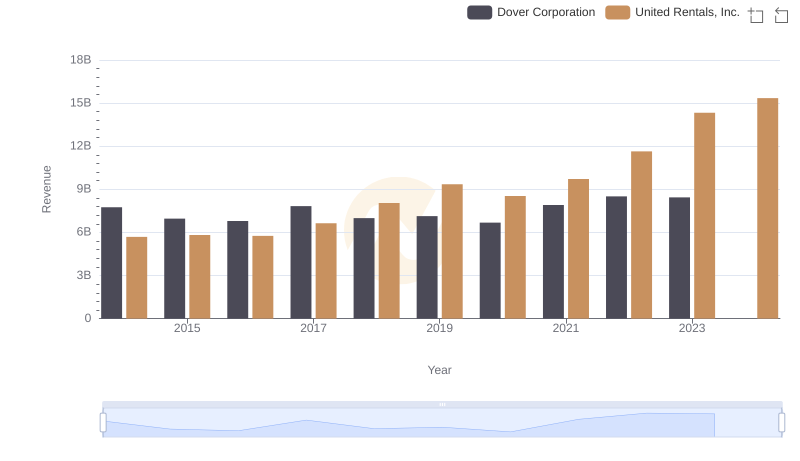
United Rentals, Inc. or Dover Corporation: Who Leads in Yearly Revenue?
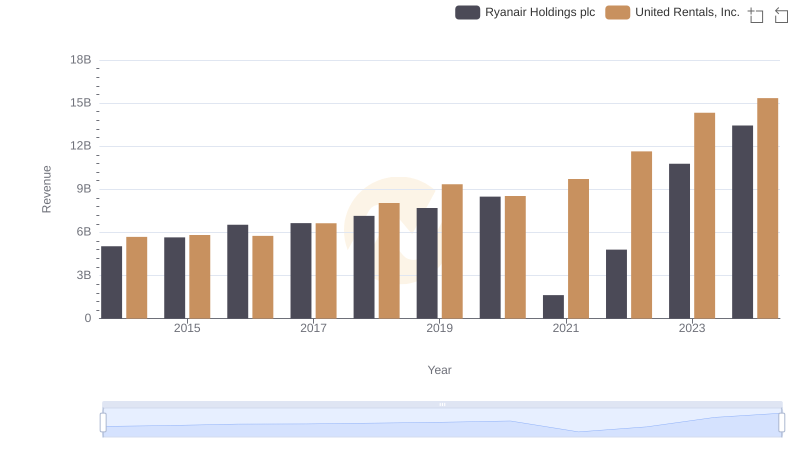
Revenue Insights: United Rentals, Inc. and Ryanair Holdings plc Performance Compared
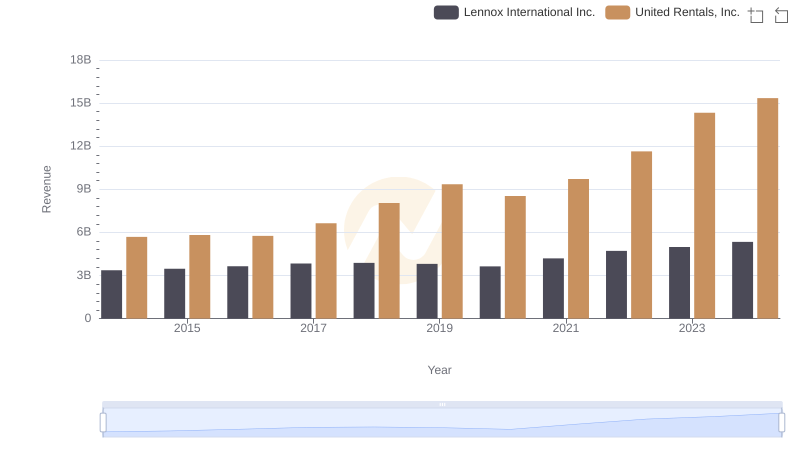
United Rentals, Inc. vs Lennox International Inc.: Annual Revenue Growth Compared
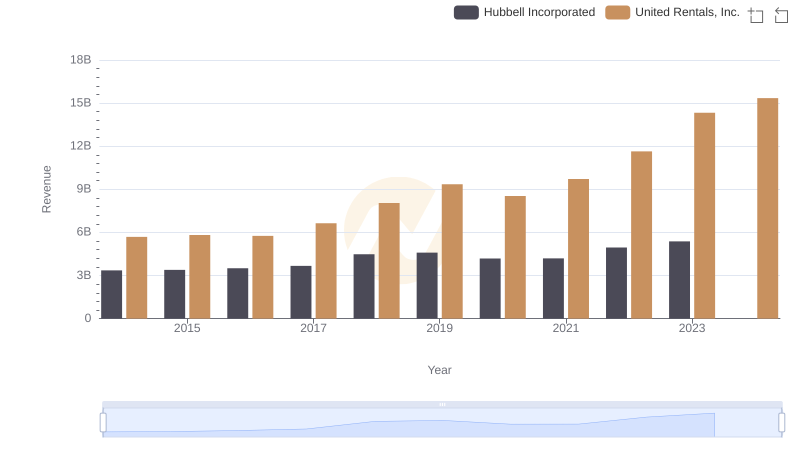
Revenue Showdown: United Rentals, Inc. vs Hubbell Incorporated
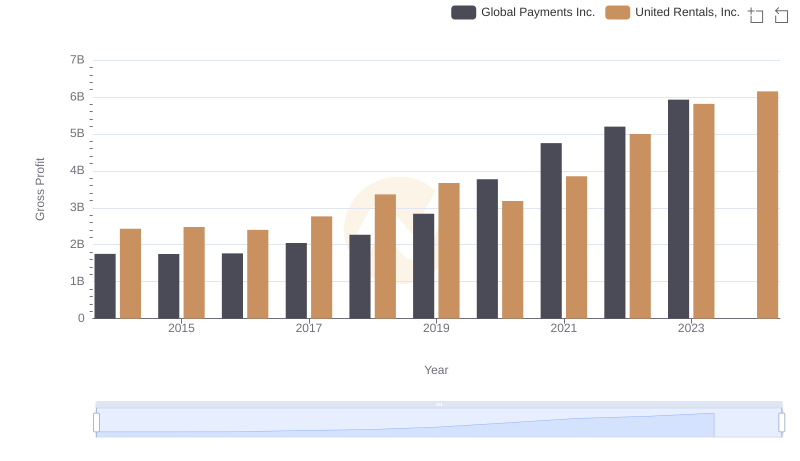
United Rentals, Inc. vs Global Payments Inc.: A Gross Profit Performance Breakdown
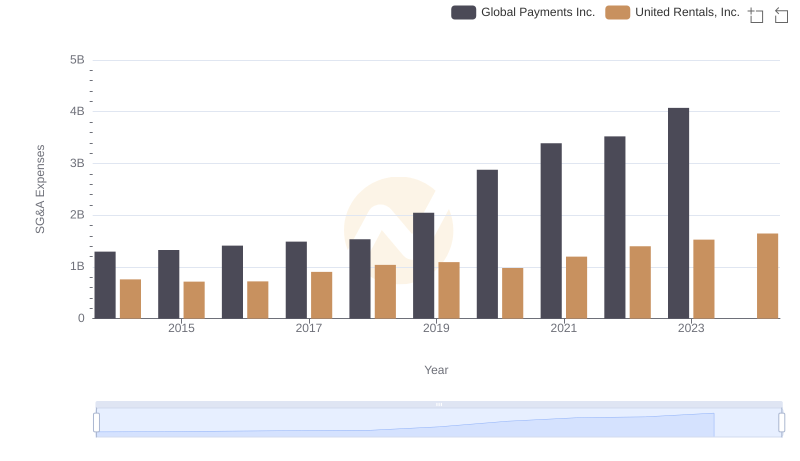
United Rentals, Inc. and Global Payments Inc.: SG&A Spending Patterns Compared
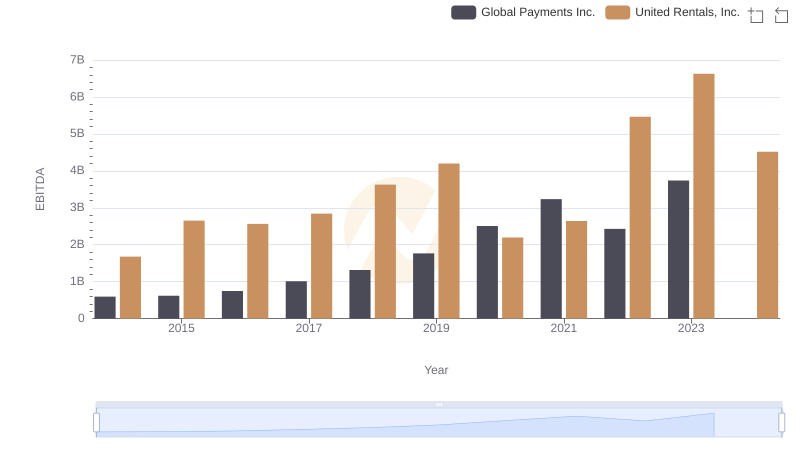
A Side-by-Side Analysis of EBITDA: United Rentals, Inc. and Global Payments Inc.