| __timestamp | EMCOR Group, Inc. | United Rentals, Inc. |
|---|---|---|
| Wednesday, January 1, 2014 | 907246000 | 2432000000 |
| Thursday, January 1, 2015 | 944479000 | 2480000000 |
| Friday, January 1, 2016 | 1037862000 | 2403000000 |
| Sunday, January 1, 2017 | 1147012000 | 2769000000 |
| Monday, January 1, 2018 | 1205453000 | 3364000000 |
| Tuesday, January 1, 2019 | 1355868000 | 3670000000 |
| Wednesday, January 1, 2020 | 1395382000 | 3183000000 |
| Friday, January 1, 2021 | 1501737000 | 3853000000 |
| Saturday, January 1, 2022 | 1603594000 | 4996000000 |
| Sunday, January 1, 2023 | 2089339000 | 5813000000 |
| Monday, January 1, 2024 | 6150000000 |
Data in motion
In the competitive landscape of the construction and engineering sectors, United Rentals, Inc. and EMCOR Group, Inc. have shown remarkable growth in their gross profits over the past decade. From 2014 to 2023, United Rentals, Inc. has consistently outperformed EMCOR Group, Inc., with a gross profit increase of approximately 139%, reaching a peak of $5.8 billion in 2023. Meanwhile, EMCOR Group, Inc. has also demonstrated a robust growth trajectory, with a 130% rise in gross profit, culminating in $2.1 billion in the same year.
The data for 2024 is incomplete, suggesting potential for further analysis as new information becomes available.
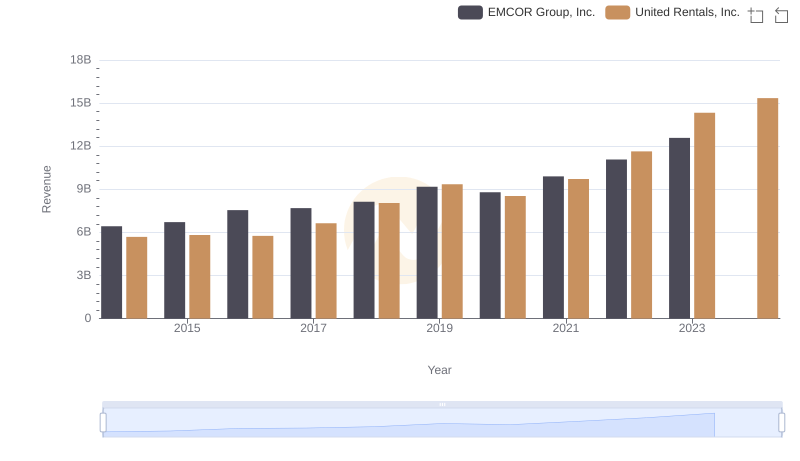
United Rentals, Inc. vs EMCOR Group, Inc.: Examining Key Revenue Metrics
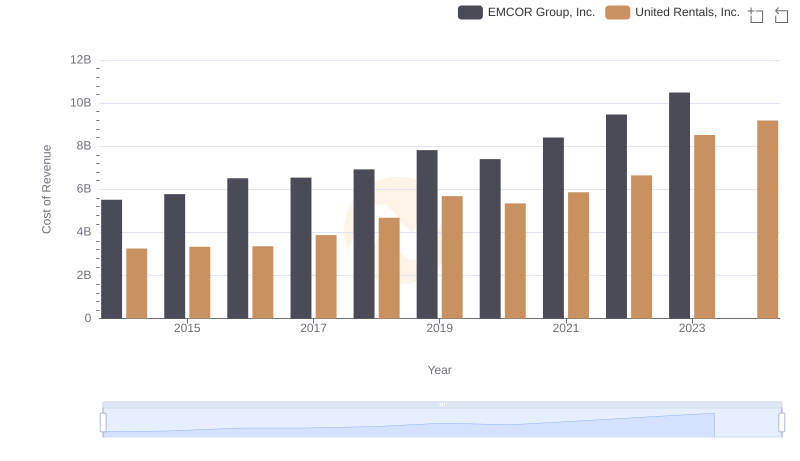
United Rentals, Inc. vs EMCOR Group, Inc.: Efficiency in Cost of Revenue Explored
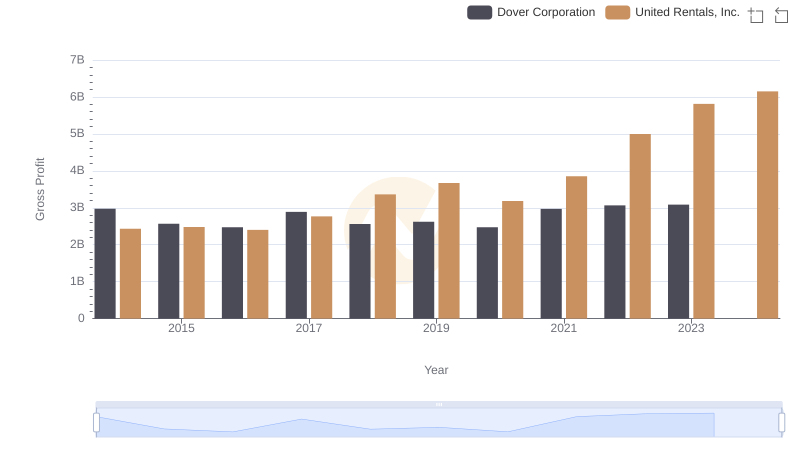
Gross Profit Trends Compared: United Rentals, Inc. vs Dover Corporation
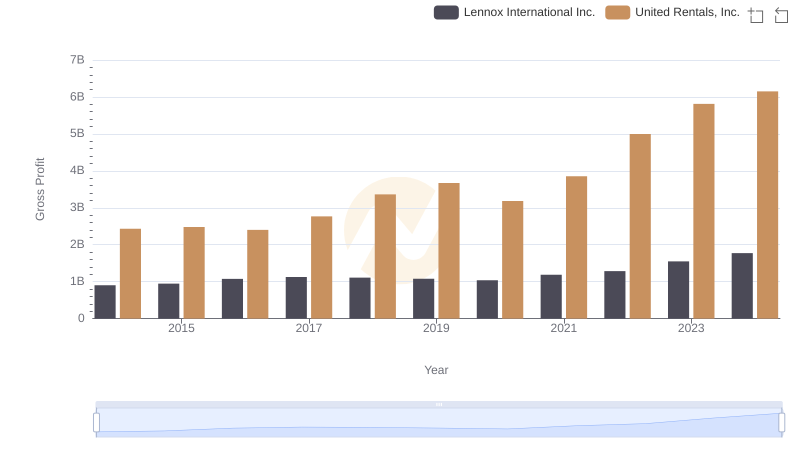
Gross Profit Comparison: United Rentals, Inc. and Lennox International Inc. Trends
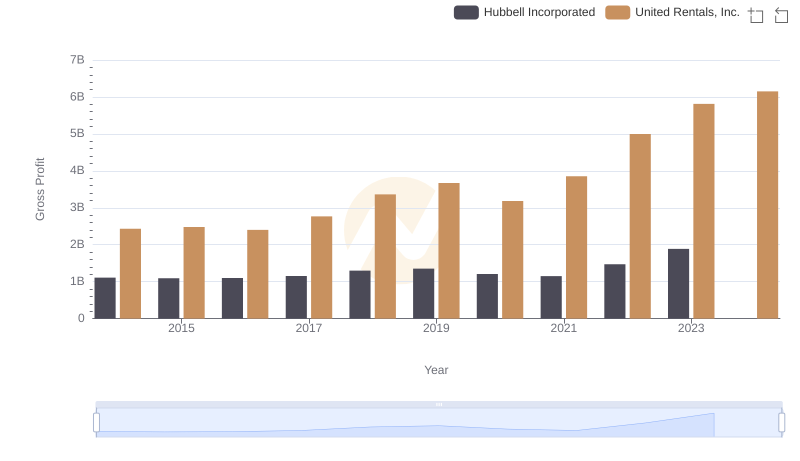
Who Generates Higher Gross Profit? United Rentals, Inc. or Hubbell Incorporated
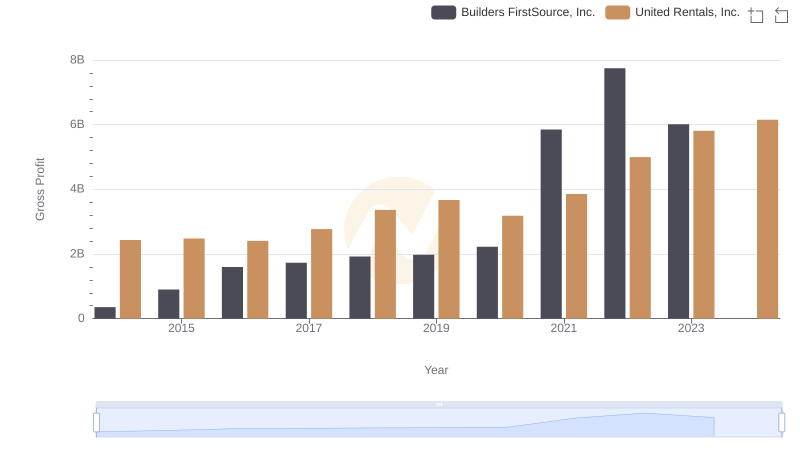
Gross Profit Comparison: United Rentals, Inc. and Builders FirstSource, Inc. Trends
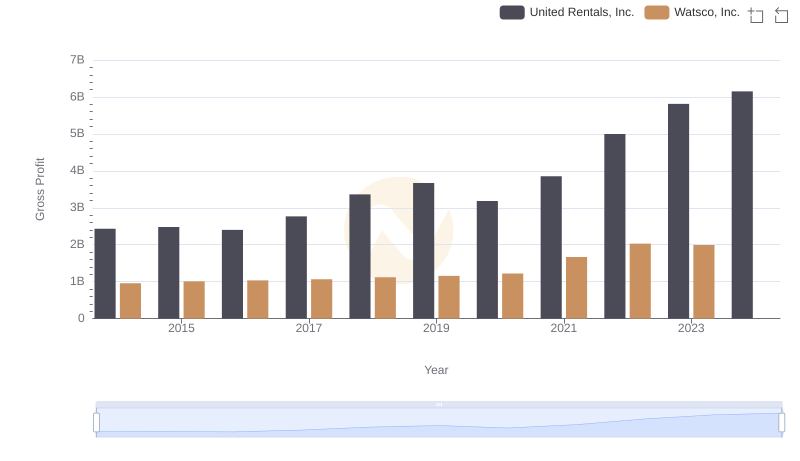
Gross Profit Analysis: Comparing United Rentals, Inc. and Watsco, Inc.
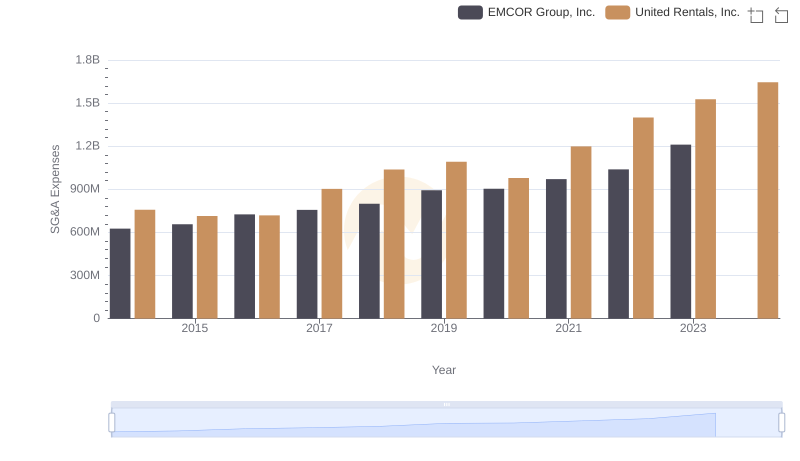
SG&A Efficiency Analysis: Comparing United Rentals, Inc. and EMCOR Group, Inc.
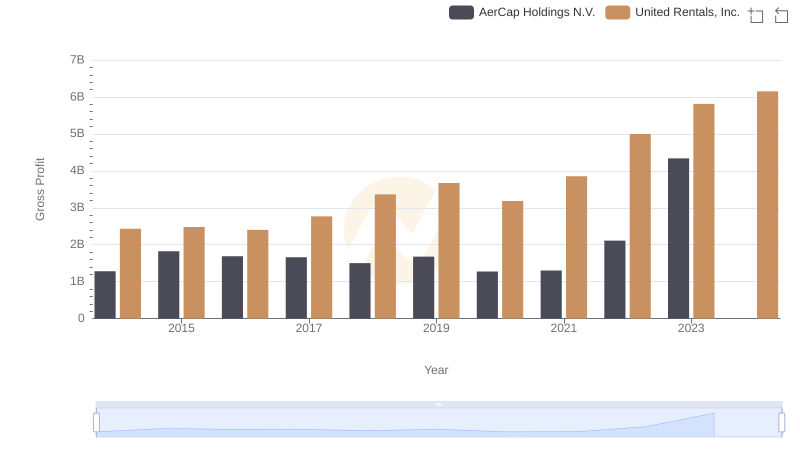
Gross Profit Analysis: Comparing United Rentals, Inc. and AerCap Holdings N.V.
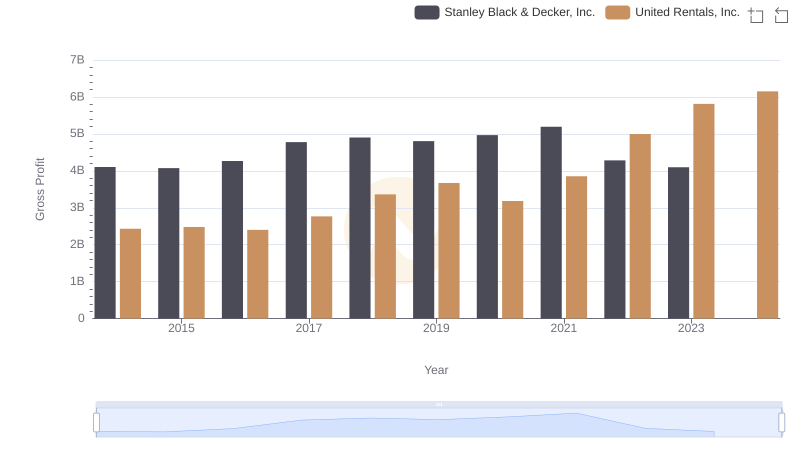
Gross Profit Analysis: Comparing United Rentals, Inc. and Stanley Black & Decker, Inc.
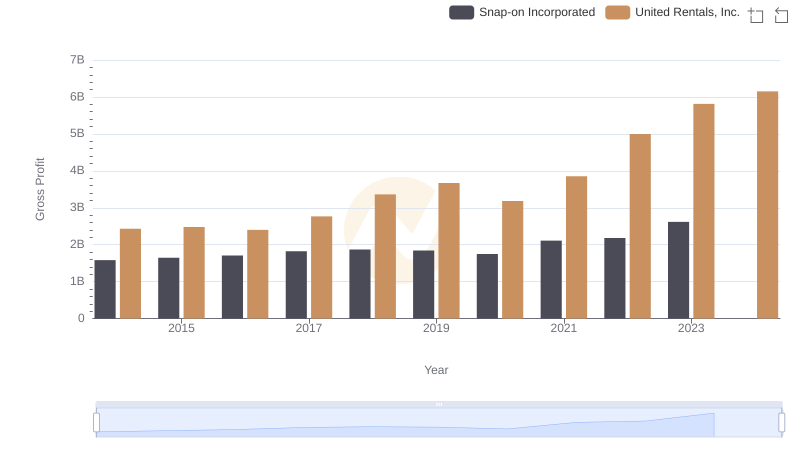
Gross Profit Analysis: Comparing United Rentals, Inc. and Snap-on Incorporated

Comprehensive EBITDA Comparison: United Rentals, Inc. vs EMCOR Group, Inc.