| __timestamp | EMCOR Group, Inc. | United Rentals, Inc. |
|---|---|---|
| Wednesday, January 1, 2014 | 6424965000 | 5685000000 |
| Thursday, January 1, 2015 | 6718726000 | 5817000000 |
| Friday, January 1, 2016 | 7551524000 | 5762000000 |
| Sunday, January 1, 2017 | 7686999000 | 6641000000 |
| Monday, January 1, 2018 | 8130631000 | 8047000000 |
| Tuesday, January 1, 2019 | 9174611000 | 9351000000 |
| Wednesday, January 1, 2020 | 8797061000 | 8530000000 |
| Friday, January 1, 2021 | 9903580000 | 9716000000 |
| Saturday, January 1, 2022 | 11076120000 | 11642000000 |
| Sunday, January 1, 2023 | 12582873000 | 14332000000 |
| Monday, January 1, 2024 | 15345000000 |
Cracking the code
In the ever-evolving landscape of industrial services, United Rentals, Inc. and EMCOR Group, Inc. have emerged as formidable players. Over the past decade, both companies have demonstrated impressive revenue growth, with United Rentals leading the charge. From 2014 to 2023, United Rentals saw its revenue soar by approximately 152%, reaching a peak of $14.3 billion in 2023. Meanwhile, EMCOR Group experienced a robust 96% increase, culminating in $12.6 billion in the same year.
The data reveals a fascinating trend: United Rentals consistently outpaced EMCOR Group in revenue growth, particularly from 2018 onwards. This period marked a significant turning point, with United Rentals surpassing EMCOR Group in revenue for the first time. As we look to the future, the absence of 2024 data for EMCOR Group leaves us eagerly anticipating whether this trend will continue.
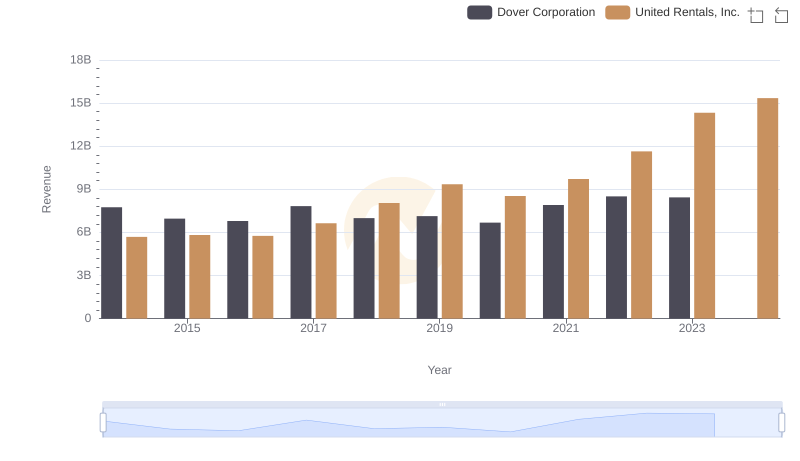
United Rentals, Inc. or Dover Corporation: Who Leads in Yearly Revenue?
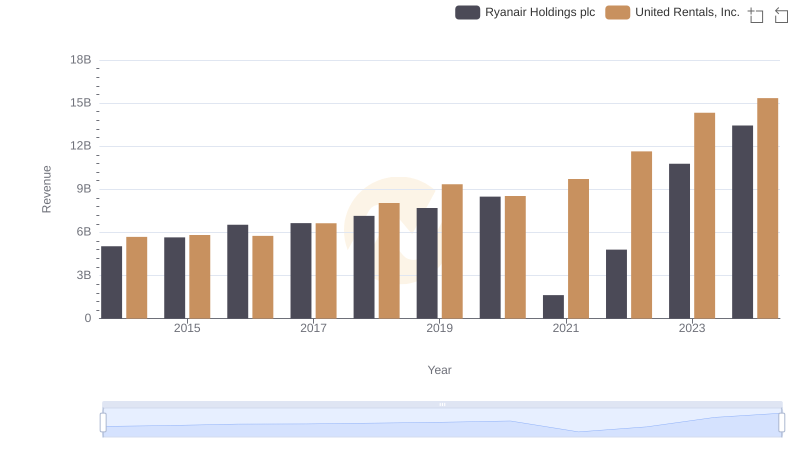
Revenue Insights: United Rentals, Inc. and Ryanair Holdings plc Performance Compared
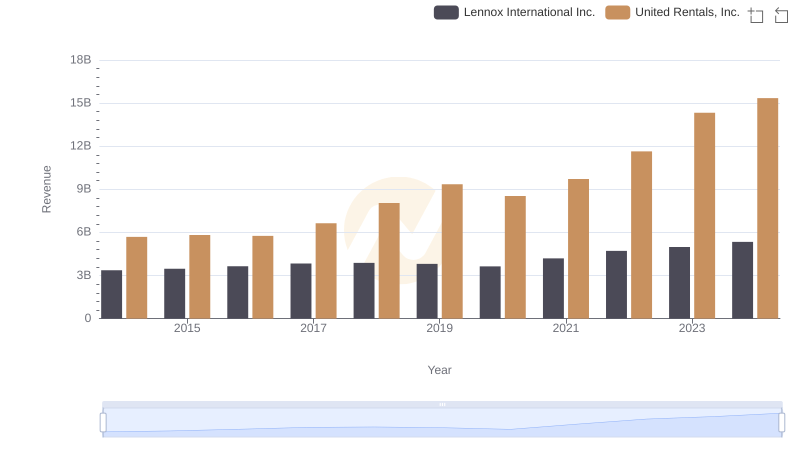
United Rentals, Inc. vs Lennox International Inc.: Annual Revenue Growth Compared
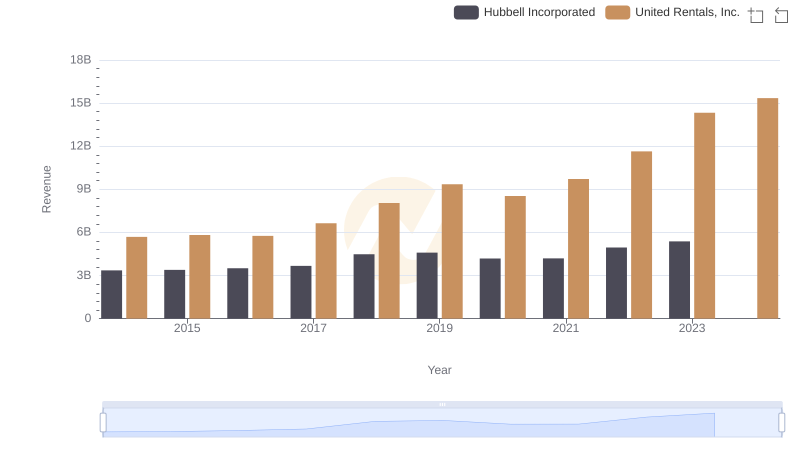
Revenue Showdown: United Rentals, Inc. vs Hubbell Incorporated
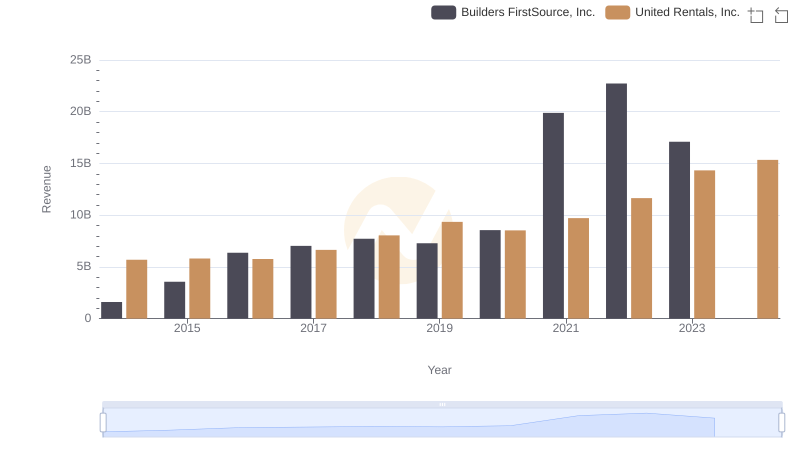
United Rentals, Inc. or Builders FirstSource, Inc.: Who Leads in Yearly Revenue?
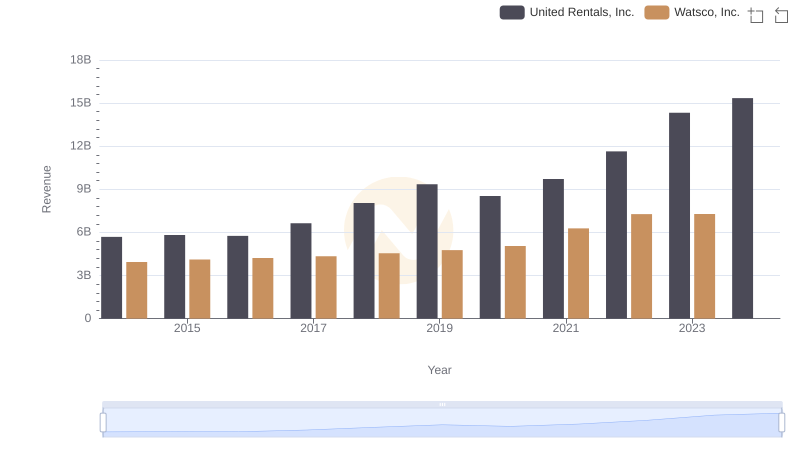
United Rentals, Inc. or Watsco, Inc.: Who Leads in Yearly Revenue?
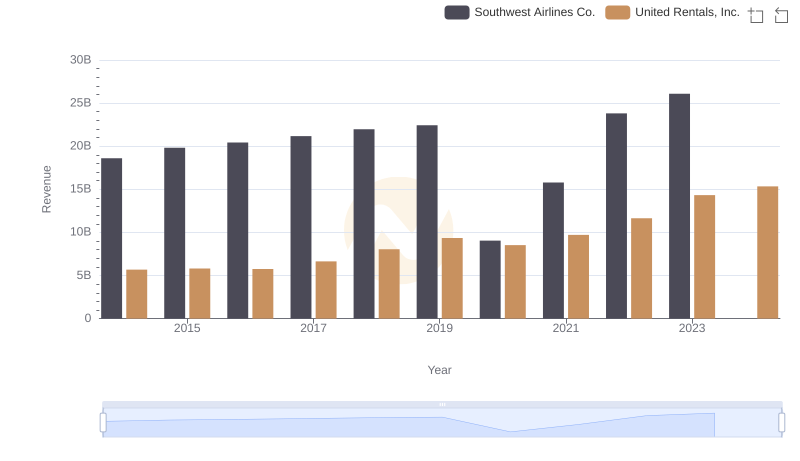
Comparing Revenue Performance: United Rentals, Inc. or Southwest Airlines Co.?
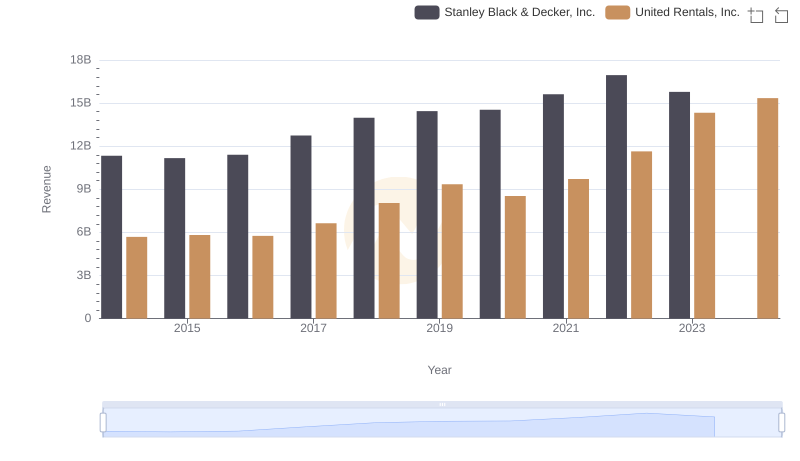
Comparing Revenue Performance: United Rentals, Inc. or Stanley Black & Decker, Inc.?
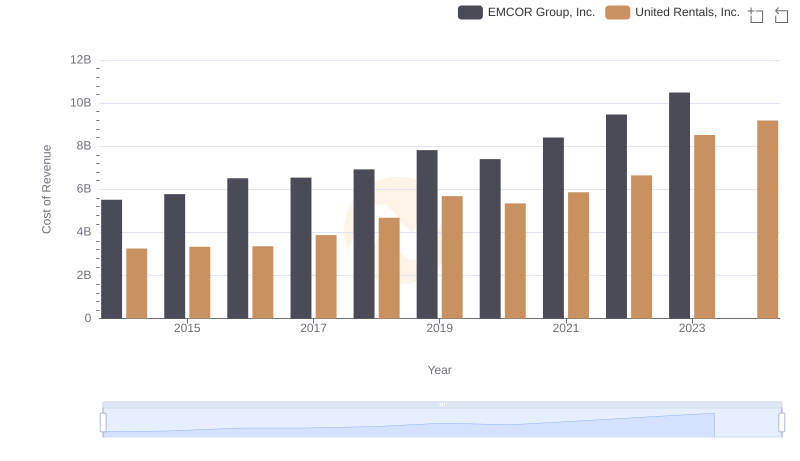
United Rentals, Inc. vs EMCOR Group, Inc.: Efficiency in Cost of Revenue Explored
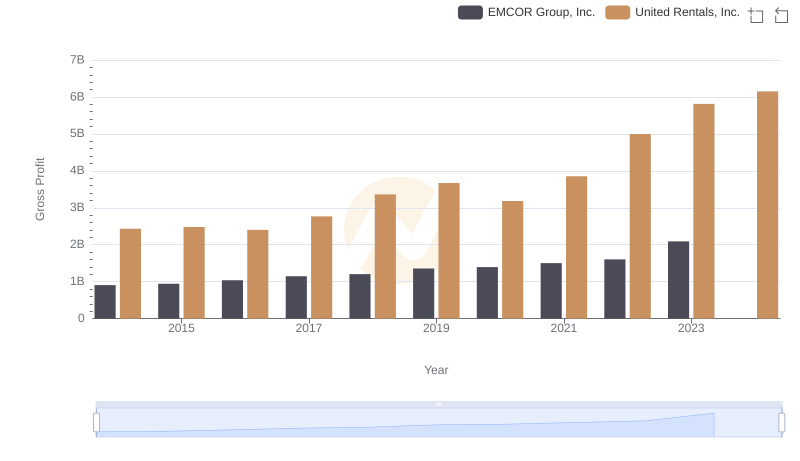
United Rentals, Inc. and EMCOR Group, Inc.: A Detailed Gross Profit Analysis
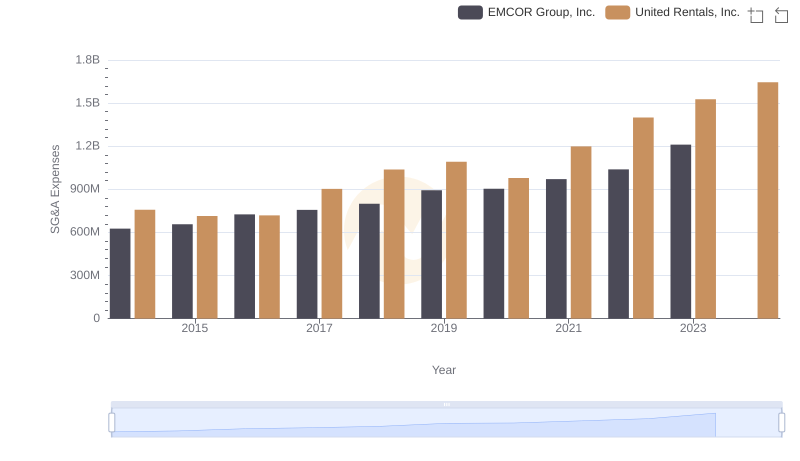
SG&A Efficiency Analysis: Comparing United Rentals, Inc. and EMCOR Group, Inc.

Comprehensive EBITDA Comparison: United Rentals, Inc. vs EMCOR Group, Inc.