| __timestamp | EMCOR Group, Inc. | United Rentals, Inc. |
|---|---|---|
| Wednesday, January 1, 2014 | 626478000 | 758000000 |
| Thursday, January 1, 2015 | 656573000 | 714000000 |
| Friday, January 1, 2016 | 725538000 | 719000000 |
| Sunday, January 1, 2017 | 757062000 | 903000000 |
| Monday, January 1, 2018 | 799157000 | 1038000000 |
| Tuesday, January 1, 2019 | 893453000 | 1092000000 |
| Wednesday, January 1, 2020 | 903584000 | 979000000 |
| Friday, January 1, 2021 | 970937000 | 1199000000 |
| Saturday, January 1, 2022 | 1038717000 | 1400000000 |
| Sunday, January 1, 2023 | 1211233000 | 1527000000 |
| Monday, January 1, 2024 | 1645000000 |
Unleashing insights
In the competitive landscape of industrial services, understanding the efficiency of Selling, General, and Administrative (SG&A) expenses is crucial. Over the past decade, United Rentals, Inc. and EMCOR Group, Inc. have demonstrated distinct trends in their SG&A expenditures. From 2014 to 2023, United Rentals saw a significant increase of approximately 101% in their SG&A expenses, peaking at $1.527 billion in 2023. In contrast, EMCOR Group's SG&A expenses grew by about 93%, reaching $1.211 billion in the same year. This data highlights United Rentals' aggressive expansion strategy, reflected in their higher SG&A growth. However, the absence of 2024 data for EMCOR suggests a potential gap in reporting or strategic shifts. As these industry giants continue to evolve, monitoring their SG&A efficiency will provide valuable insights into their operational strategies and market positioning.
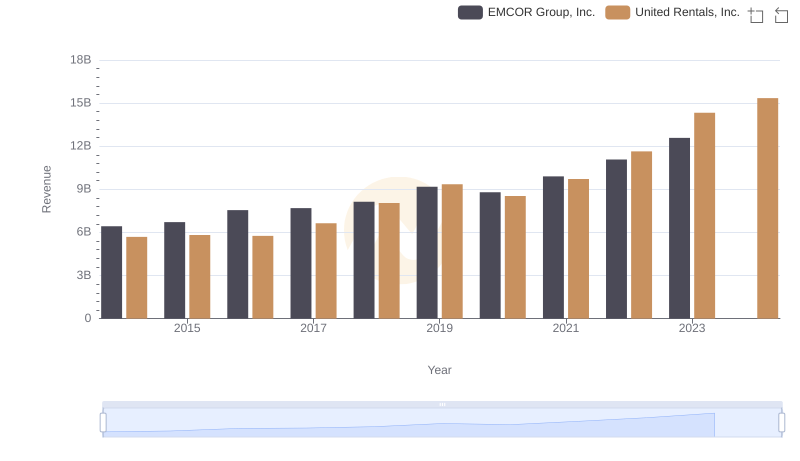
United Rentals, Inc. vs EMCOR Group, Inc.: Examining Key Revenue Metrics
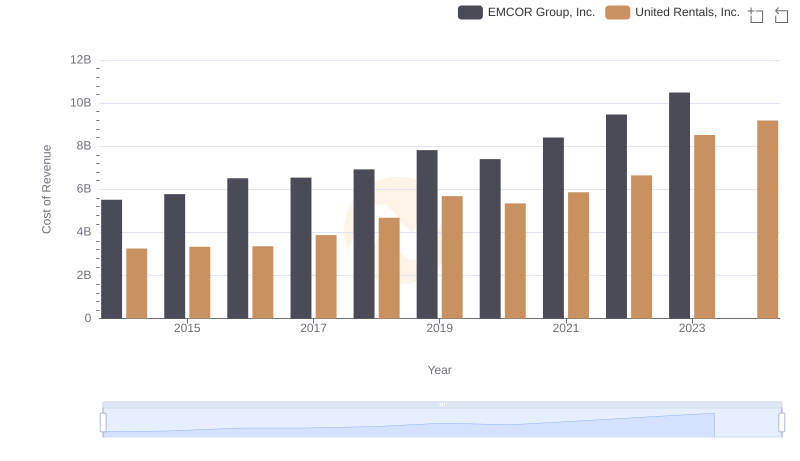
United Rentals, Inc. vs EMCOR Group, Inc.: Efficiency in Cost of Revenue Explored
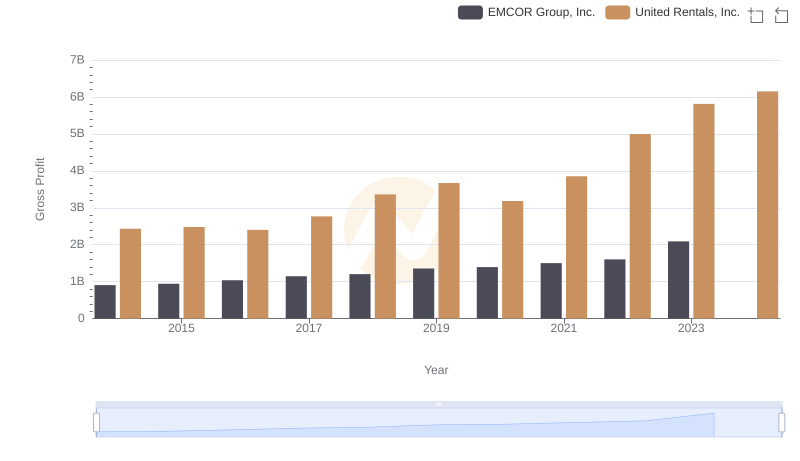
United Rentals, Inc. and EMCOR Group, Inc.: A Detailed Gross Profit Analysis
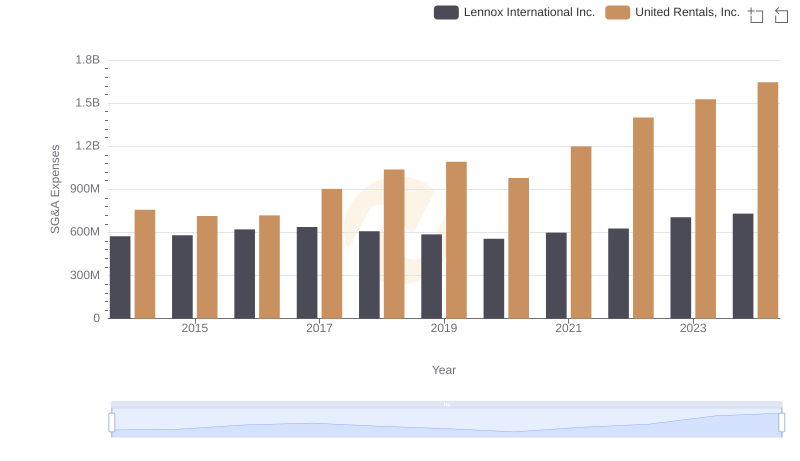
United Rentals, Inc. and Lennox International Inc.: SG&A Spending Patterns Compared
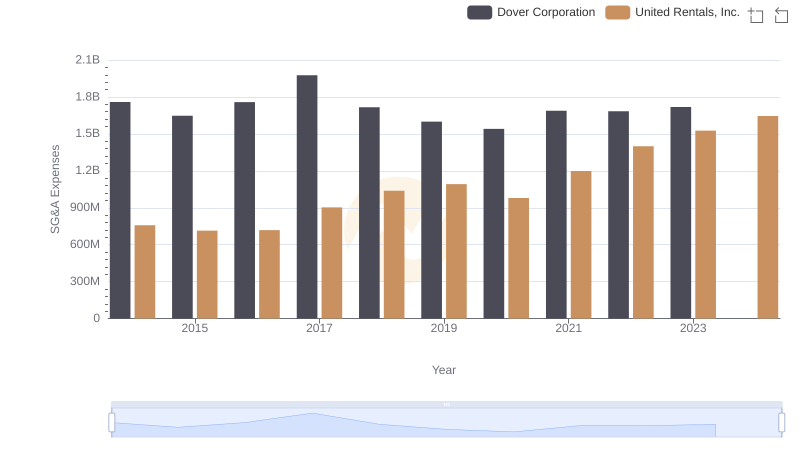
Operational Costs Compared: SG&A Analysis of United Rentals, Inc. and Dover Corporation
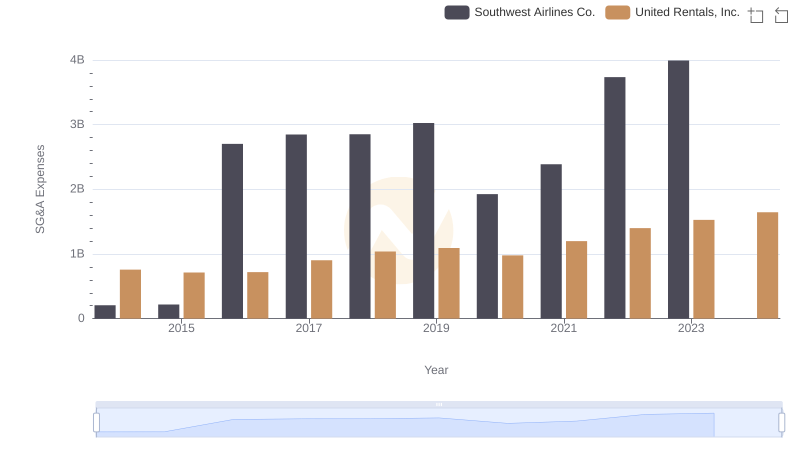
Cost Management Insights: SG&A Expenses for United Rentals, Inc. and Southwest Airlines Co.
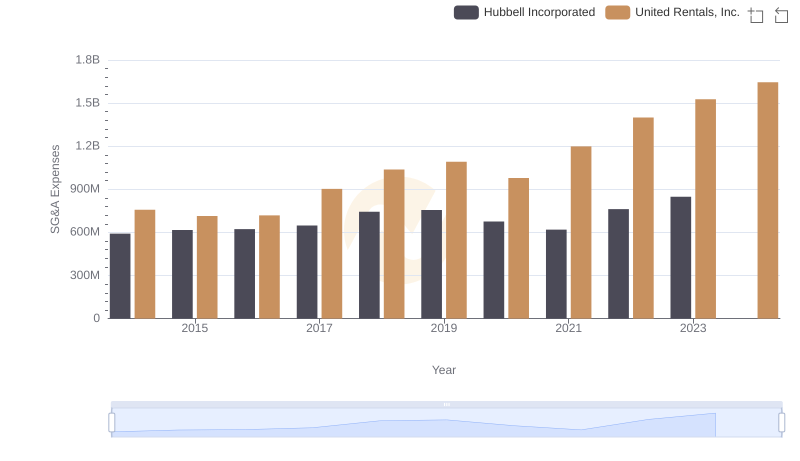
Who Optimizes SG&A Costs Better? United Rentals, Inc. or Hubbell Incorporated
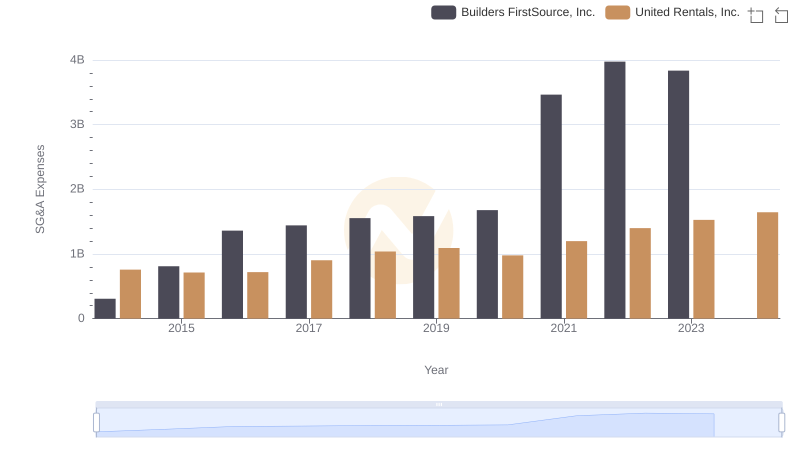
Who Optimizes SG&A Costs Better? United Rentals, Inc. or Builders FirstSource, Inc.
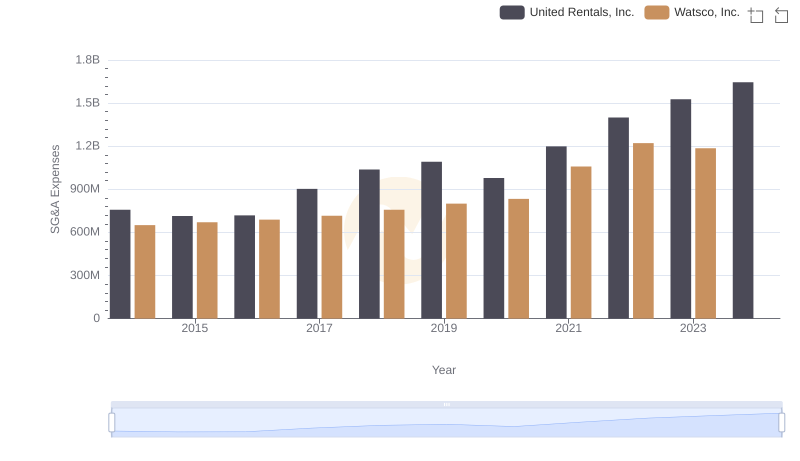
Cost Management Insights: SG&A Expenses for United Rentals, Inc. and Watsco, Inc.
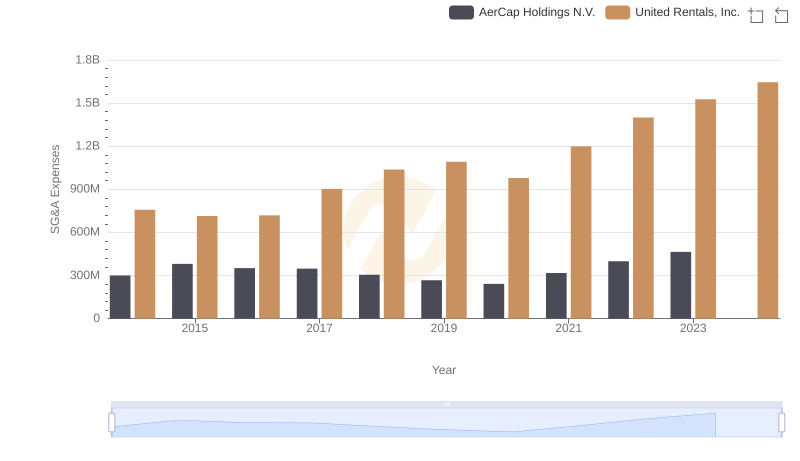
Cost Management Insights: SG&A Expenses for United Rentals, Inc. and AerCap Holdings N.V.

Comprehensive EBITDA Comparison: United Rentals, Inc. vs EMCOR Group, Inc.
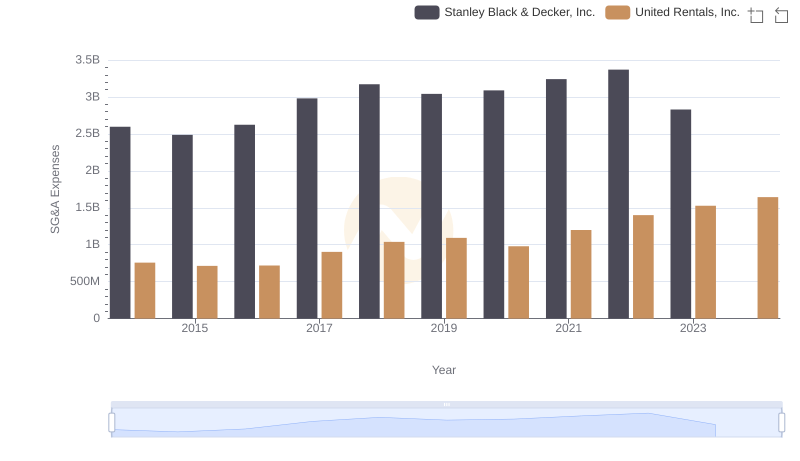
Selling, General, and Administrative Costs: United Rentals, Inc. vs Stanley Black & Decker, Inc.