| __timestamp | Builders FirstSource, Inc. | United Rentals, Inc. |
|---|---|---|
| Wednesday, January 1, 2014 | 306508000 | 758000000 |
| Thursday, January 1, 2015 | 810841000 | 714000000 |
| Friday, January 1, 2016 | 1360412000 | 719000000 |
| Sunday, January 1, 2017 | 1442288000 | 903000000 |
| Monday, January 1, 2018 | 1553972000 | 1038000000 |
| Tuesday, January 1, 2019 | 1584523000 | 1092000000 |
| Wednesday, January 1, 2020 | 1678730000 | 979000000 |
| Friday, January 1, 2021 | 3463532000 | 1199000000 |
| Saturday, January 1, 2022 | 3974173000 | 1400000000 |
| Sunday, January 1, 2023 | 3836015000 | 1527000000 |
| Monday, January 1, 2024 | 1645000000 |
Cracking the code
In the competitive landscape of the construction and rental industries, managing Selling, General, and Administrative (SG&A) expenses is crucial for profitability. Over the past decade, United Rentals, Inc. and Builders FirstSource, Inc. have showcased contrasting strategies in optimizing these costs.
From 2014 to 2023, Builders FirstSource, Inc. saw a staggering increase in SG&A expenses, peaking at nearly 4 billion in 2022, reflecting a growth of over 1,200% from 2014. This surge indicates aggressive expansion and investment in administrative capabilities. In contrast, United Rentals, Inc. maintained a more stable trajectory, with expenses growing by approximately 117% over the same period, reaching 1.6 billion in 2023.
While Builders FirstSource's strategy might suggest a focus on rapid growth, United Rentals' steadier approach could imply a more controlled cost management strategy. The missing data for 2024 suggests ongoing developments in this dynamic financial narrative.
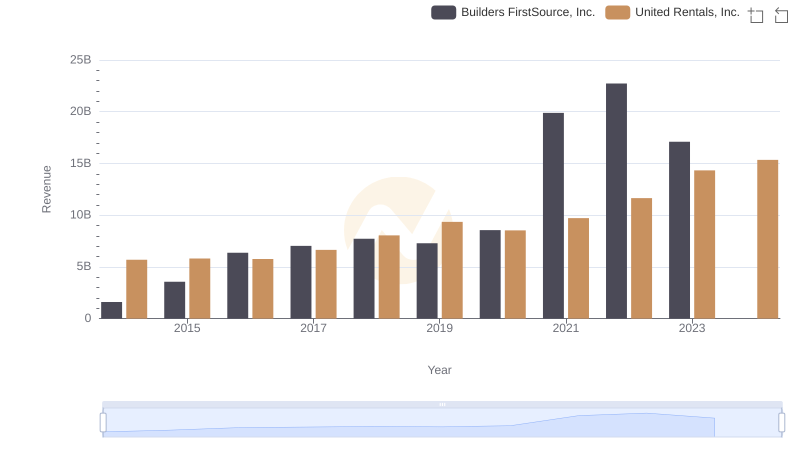
United Rentals, Inc. or Builders FirstSource, Inc.: Who Leads in Yearly Revenue?
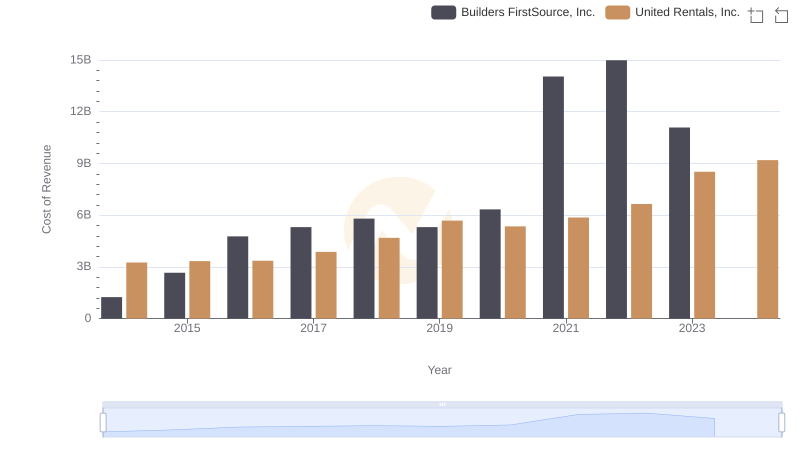
Cost Insights: Breaking Down United Rentals, Inc. and Builders FirstSource, Inc.'s Expenses
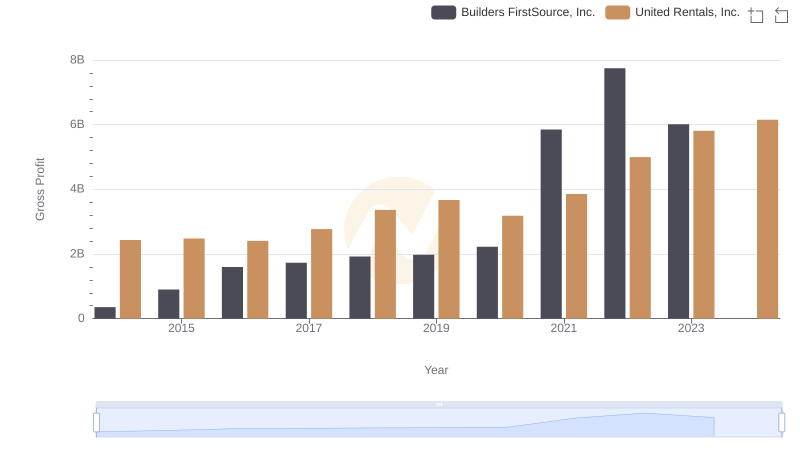
Gross Profit Comparison: United Rentals, Inc. and Builders FirstSource, Inc. Trends
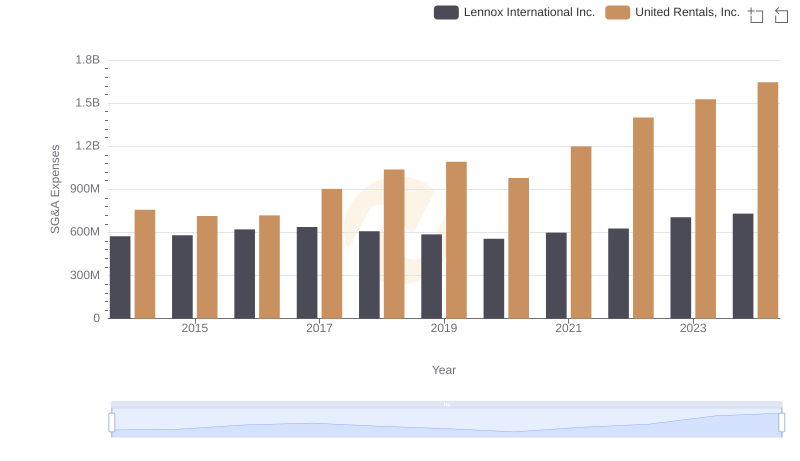
United Rentals, Inc. and Lennox International Inc.: SG&A Spending Patterns Compared
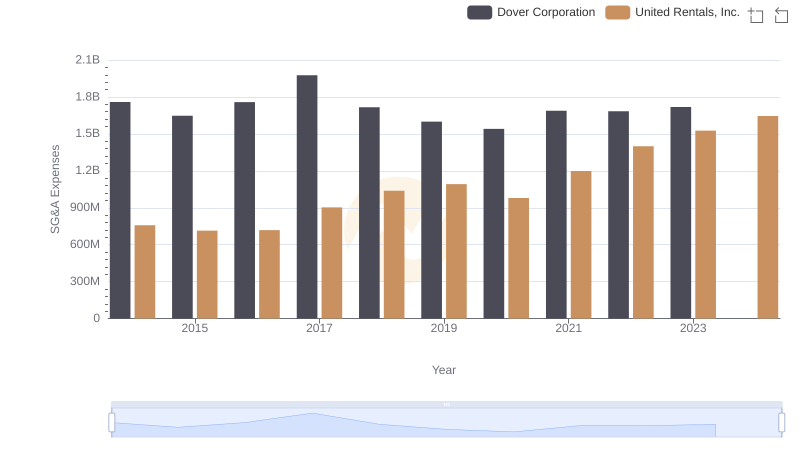
Operational Costs Compared: SG&A Analysis of United Rentals, Inc. and Dover Corporation
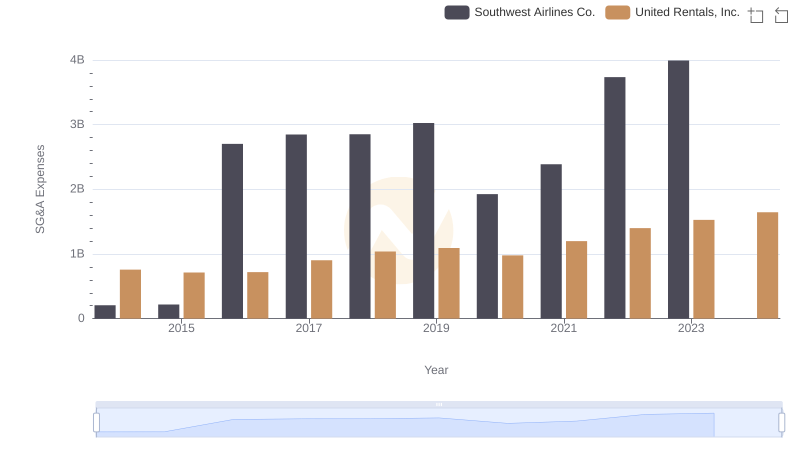
Cost Management Insights: SG&A Expenses for United Rentals, Inc. and Southwest Airlines Co.
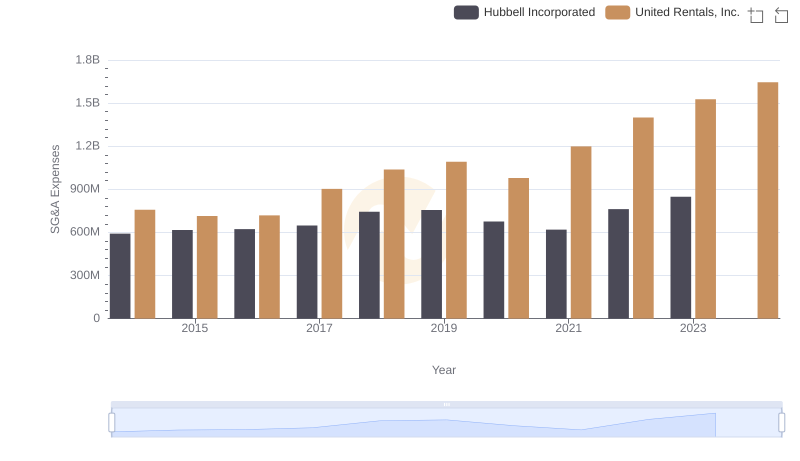
Who Optimizes SG&A Costs Better? United Rentals, Inc. or Hubbell Incorporated
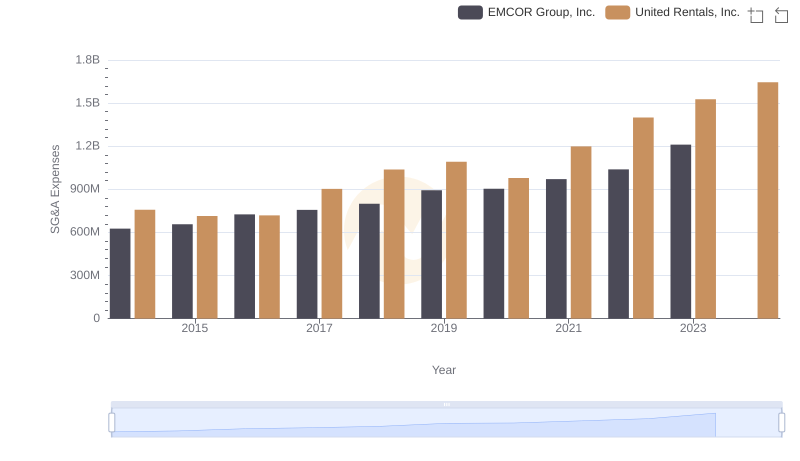
SG&A Efficiency Analysis: Comparing United Rentals, Inc. and EMCOR Group, Inc.
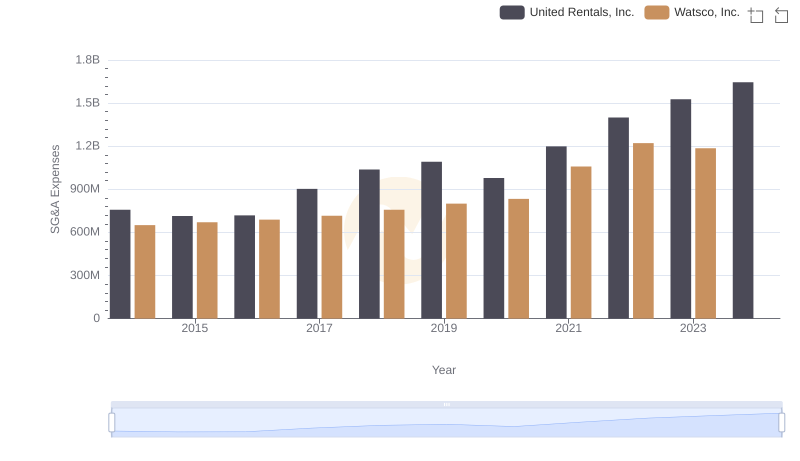
Cost Management Insights: SG&A Expenses for United Rentals, Inc. and Watsco, Inc.
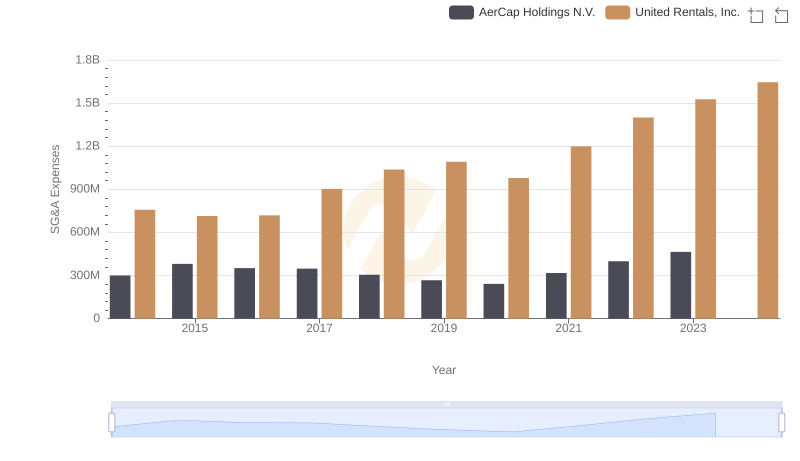
Cost Management Insights: SG&A Expenses for United Rentals, Inc. and AerCap Holdings N.V.
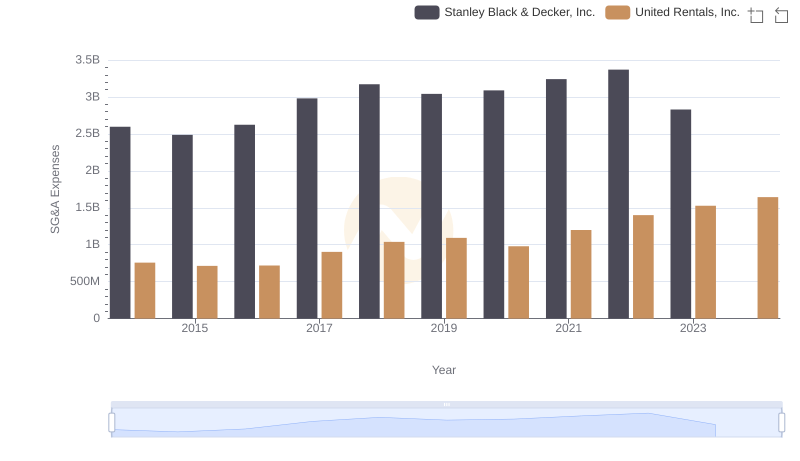
Selling, General, and Administrative Costs: United Rentals, Inc. vs Stanley Black & Decker, Inc.
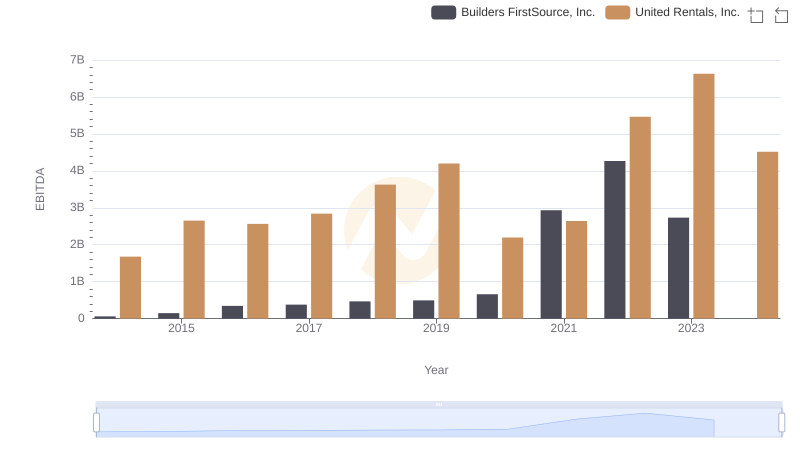
United Rentals, Inc. vs Builders FirstSource, Inc.: In-Depth EBITDA Performance Comparison