| __timestamp | Cintas Corporation | United Airlines Holdings, Inc. |
|---|---|---|
| Wednesday, January 1, 2014 | 1302752000 | 1373000000 |
| Thursday, January 1, 2015 | 1224930000 | 1342000000 |
| Friday, January 1, 2016 | 1348122000 | 1303000000 |
| Sunday, January 1, 2017 | 1527380000 | 1349000000 |
| Monday, January 1, 2018 | 1916792000 | 1558000000 |
| Tuesday, January 1, 2019 | 1980644000 | 1651000000 |
| Wednesday, January 1, 2020 | 2071052000 | 459000000 |
| Friday, January 1, 2021 | 1929159000 | 677000000 |
| Saturday, January 1, 2022 | 2044876000 | 1535000000 |
| Sunday, January 1, 2023 | 2370704000 | 1977000000 |
| Monday, January 1, 2024 | 2617783000 | 2231000000 |
Data in motion
In the world of corporate finance, Selling, General, and Administrative (SG&A) expenses are a critical measure of operational efficiency. This analysis compares Cintas Corporation, a leader in uniform rental services, with United Airlines Holdings, Inc., a major player in the aviation industry, from 2014 to 2023. Over this period, Cintas consistently increased its SG&A efficiency, with expenses rising by approximately 101% from 2014 to 2023. In contrast, United Airlines experienced a more volatile trajectory, with a significant dip in 2020, likely due to the pandemic's impact on the travel industry. By 2023, United Airlines' SG&A expenses rebounded to nearly 1.98 billion, reflecting a recovery trend. This comparison highlights the resilience and adaptability of these companies in their respective sectors, offering valuable insights into their strategic financial management.
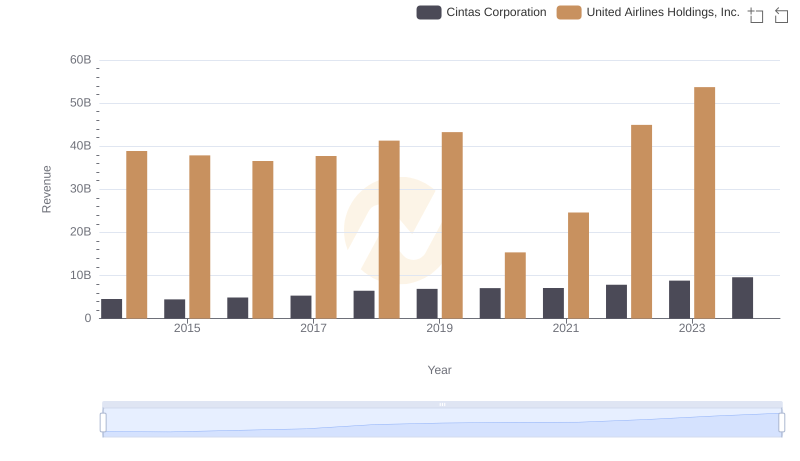
Breaking Down Revenue Trends: Cintas Corporation vs United Airlines Holdings, Inc.
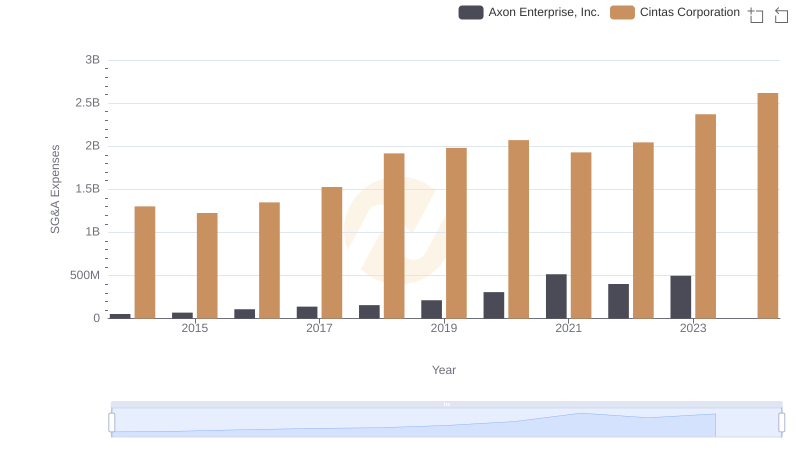
Cintas Corporation and Axon Enterprise, Inc.: SG&A Spending Patterns Compared

Cintas Corporation vs United Airlines Holdings, Inc.: Efficiency in Cost of Revenue Explored
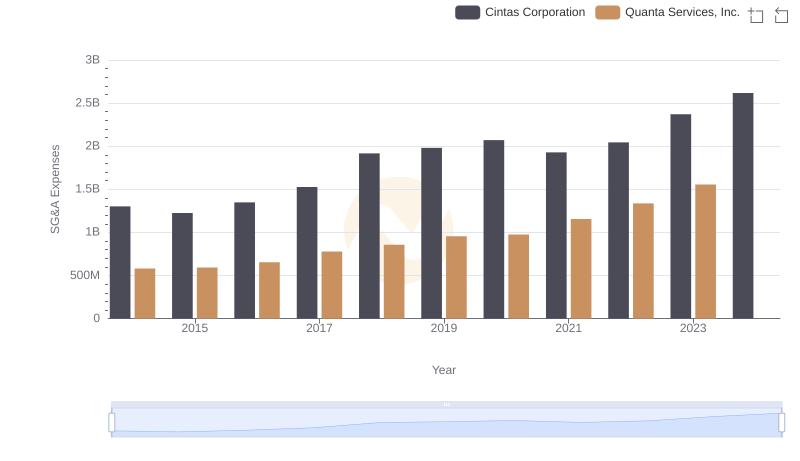
Who Optimizes SG&A Costs Better? Cintas Corporation or Quanta Services, Inc.
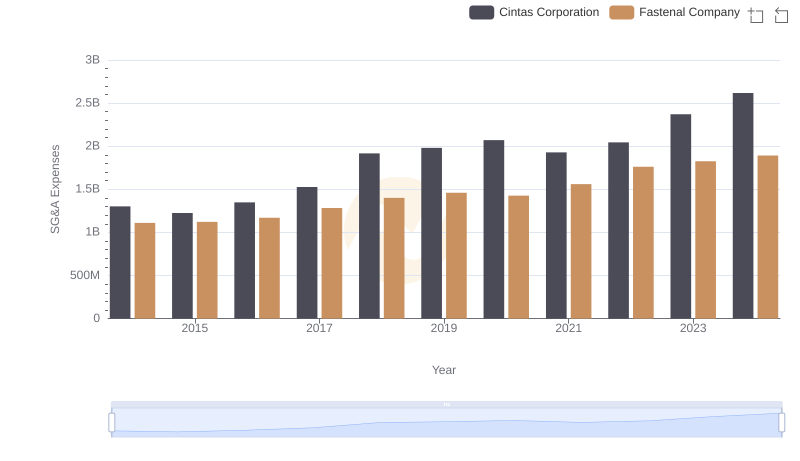
Cintas Corporation vs Fastenal Company: SG&A Expense Trends
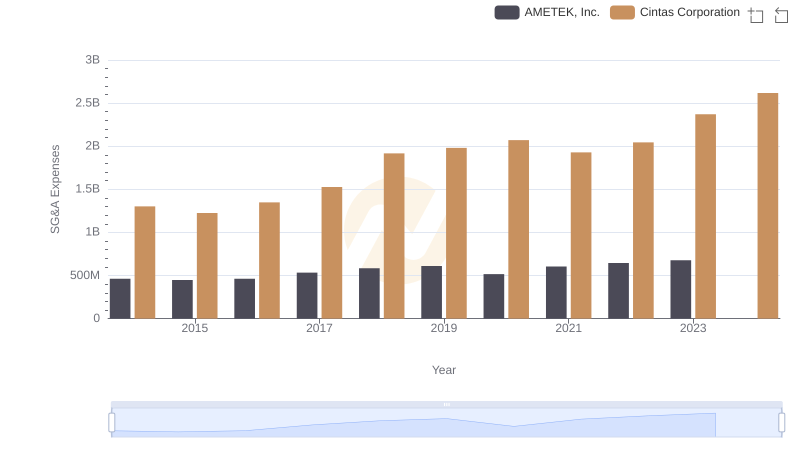
Cintas Corporation vs AMETEK, Inc.: SG&A Expense Trends
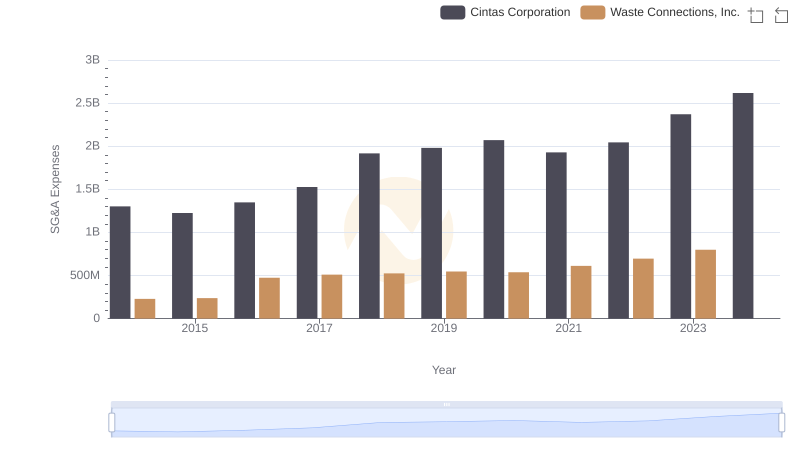
SG&A Efficiency Analysis: Comparing Cintas Corporation and Waste Connections, Inc.
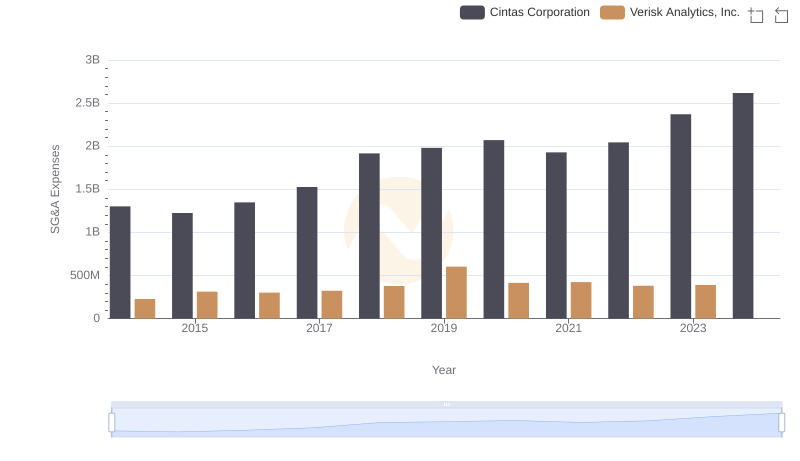
Cintas Corporation vs Verisk Analytics, Inc.: SG&A Expense Trends
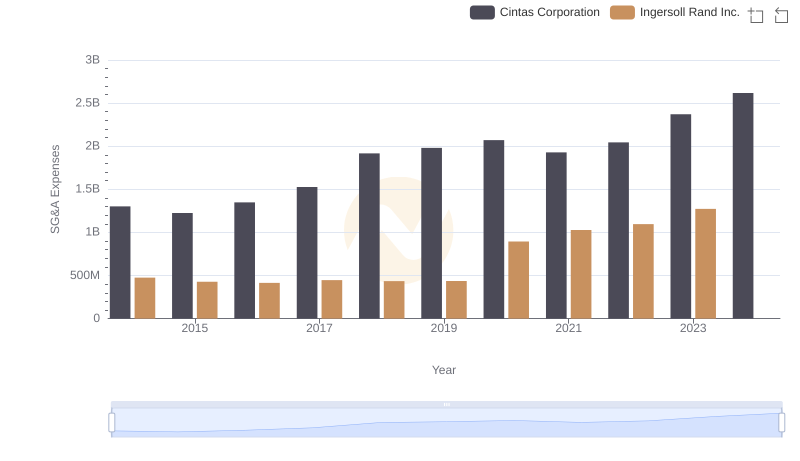
Cintas Corporation and Ingersoll Rand Inc.: SG&A Spending Patterns Compared
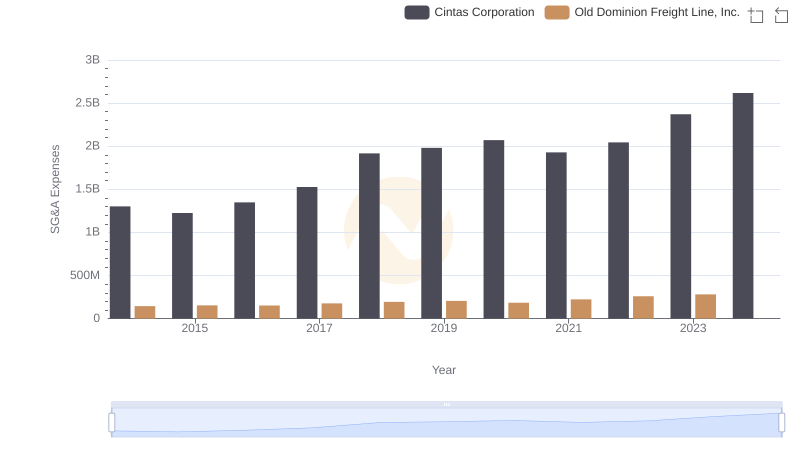
Selling, General, and Administrative Costs: Cintas Corporation vs Old Dominion Freight Line, Inc.
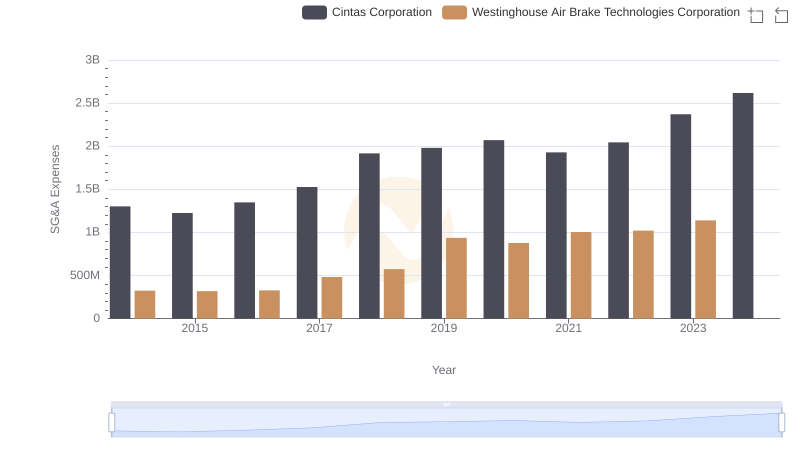
Cintas Corporation vs Westinghouse Air Brake Technologies Corporation: SG&A Expense Trends