| __timestamp | Cintas Corporation | Waste Connections, Inc. |
|---|---|---|
| Wednesday, January 1, 2014 | 1302752000 | 229474000 |
| Thursday, January 1, 2015 | 1224930000 | 237484000 |
| Friday, January 1, 2016 | 1348122000 | 474263000 |
| Sunday, January 1, 2017 | 1527380000 | 509638000 |
| Monday, January 1, 2018 | 1916792000 | 524388000 |
| Tuesday, January 1, 2019 | 1980644000 | 546278000 |
| Wednesday, January 1, 2020 | 2071052000 | 537632000 |
| Friday, January 1, 2021 | 1929159000 | 612337000 |
| Saturday, January 1, 2022 | 2044876000 | 696467000 |
| Sunday, January 1, 2023 | 2370704000 | 799119000 |
| Monday, January 1, 2024 | 2617783000 | 883445000 |
Infusing magic into the data realm
In the competitive landscape of corporate America, understanding the efficiency of Selling, General, and Administrative (SG&A) expenses is crucial. Cintas Corporation and Waste Connections, Inc. offer a fascinating comparison over the past decade.
From 2014 to 2023, Cintas Corporation has seen a consistent increase in SG&A expenses, peaking at approximately $2.37 billion in 2023. This represents an impressive 82% growth from 2014, reflecting the company's strategic investments in operational efficiency and market expansion.
Waste Connections, Inc., while smaller in scale, has also shown a significant rise in SG&A expenses, growing by nearly 248% from 2014 to 2023. This growth underscores the company's aggressive expansion and adaptation strategies in the waste management sector.
Both companies demonstrate unique approaches to managing SG&A expenses, offering valuable insights into their operational strategies.
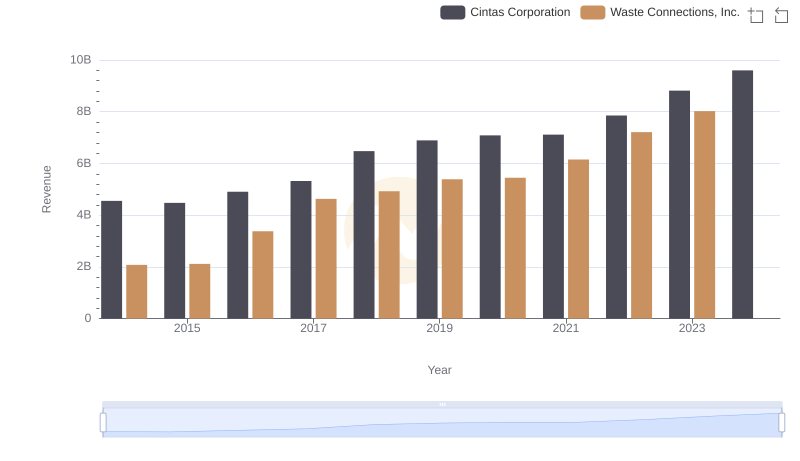
Cintas Corporation and Waste Connections, Inc.: A Comprehensive Revenue Analysis
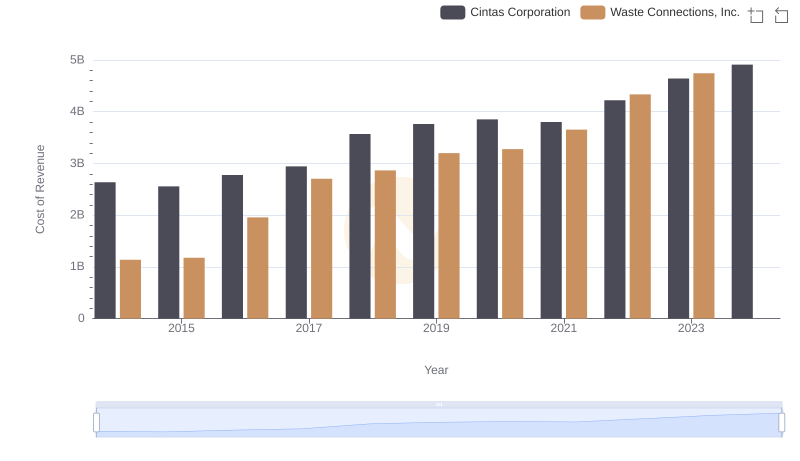
Cost of Revenue Comparison: Cintas Corporation vs Waste Connections, Inc.
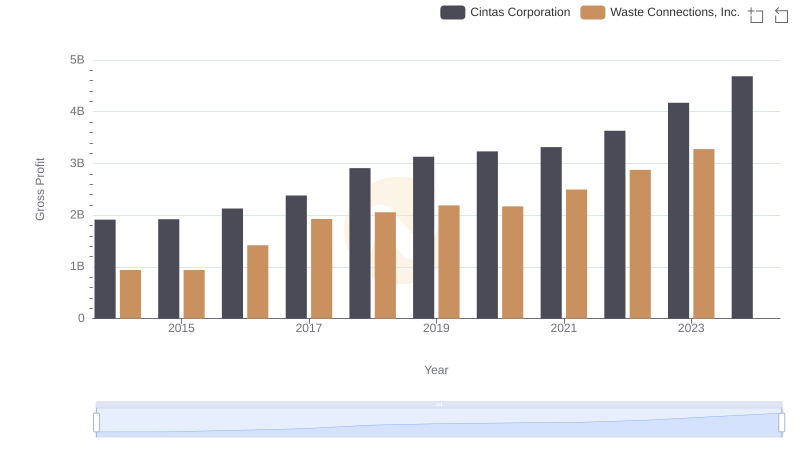
Key Insights on Gross Profit: Cintas Corporation vs Waste Connections, Inc.
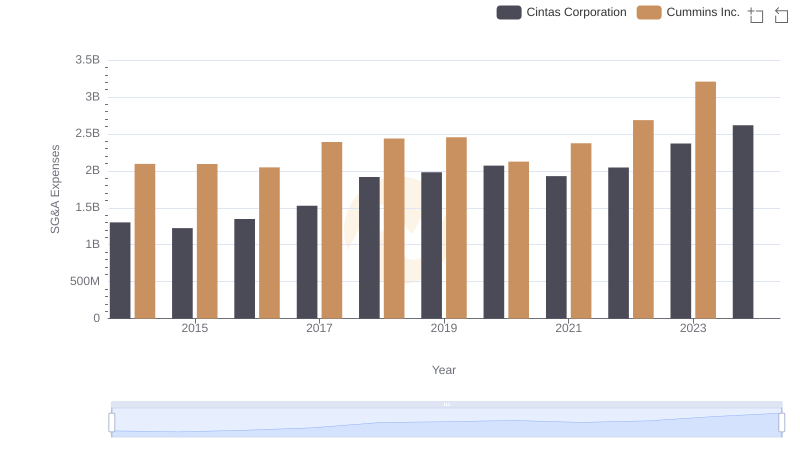
Breaking Down SG&A Expenses: Cintas Corporation vs Cummins Inc.
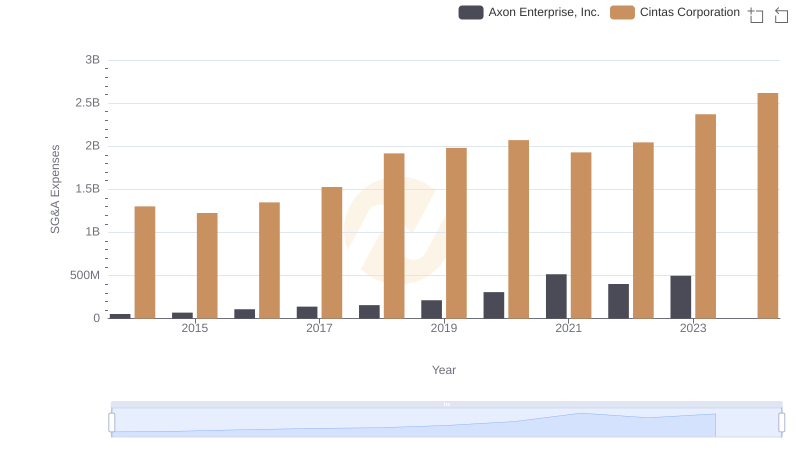
Cintas Corporation and Axon Enterprise, Inc.: SG&A Spending Patterns Compared
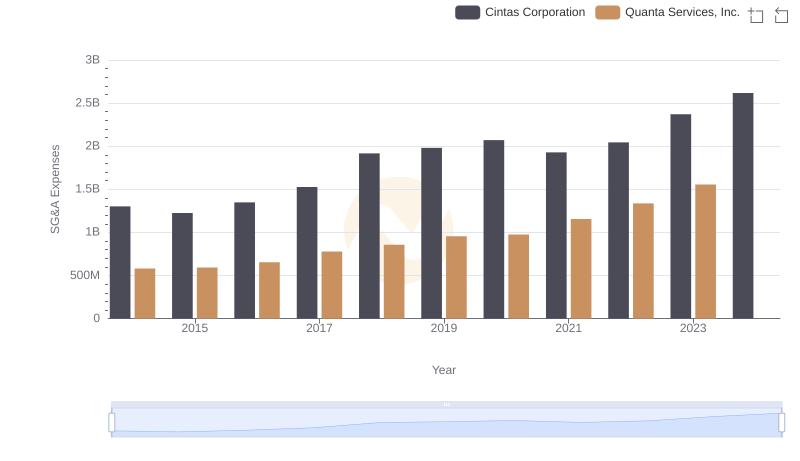
Who Optimizes SG&A Costs Better? Cintas Corporation or Quanta Services, Inc.
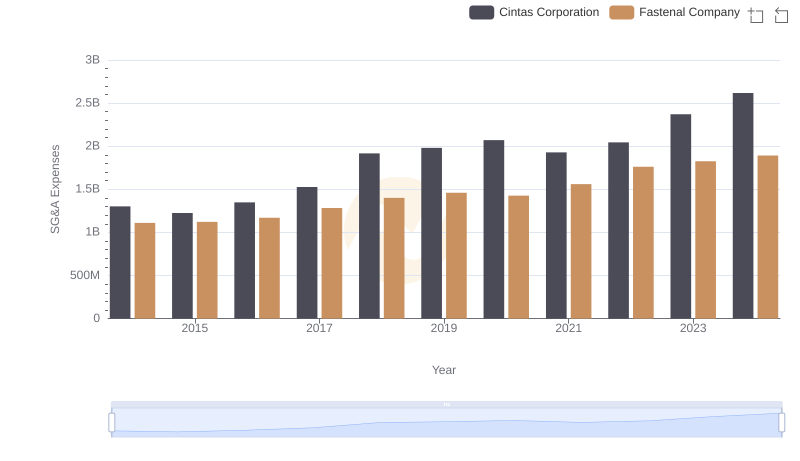
Cintas Corporation vs Fastenal Company: SG&A Expense Trends
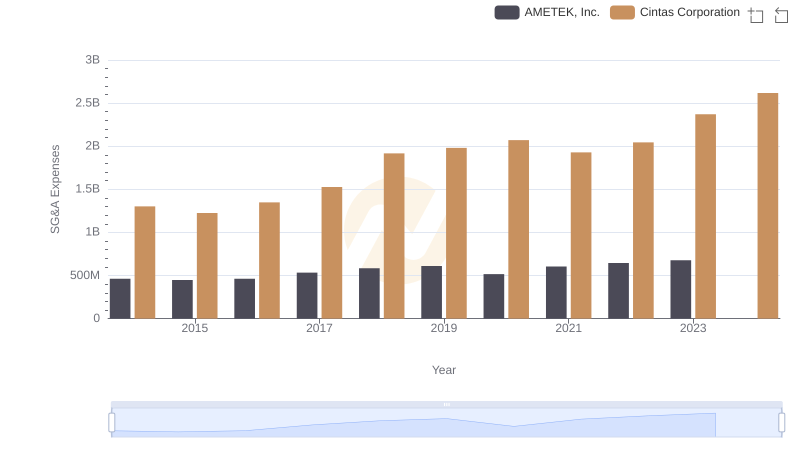
Cintas Corporation vs AMETEK, Inc.: SG&A Expense Trends
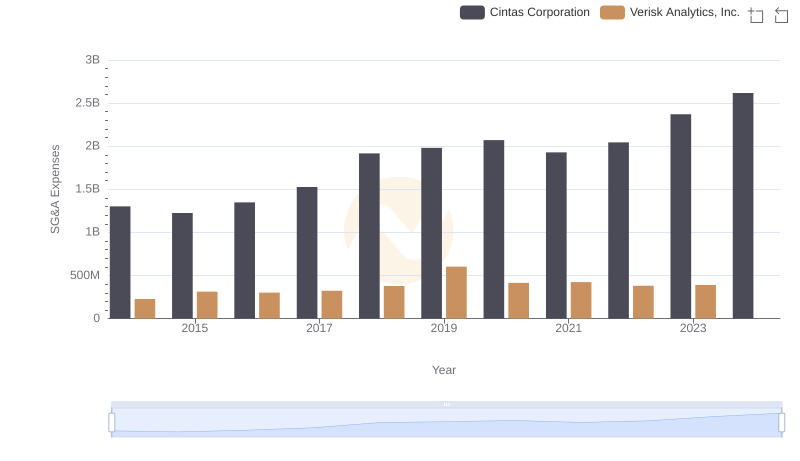
Cintas Corporation vs Verisk Analytics, Inc.: SG&A Expense Trends
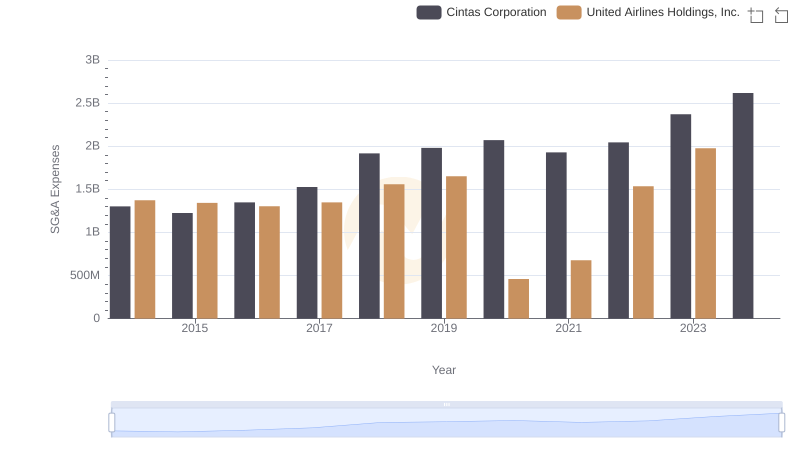
SG&A Efficiency Analysis: Comparing Cintas Corporation and United Airlines Holdings, Inc.
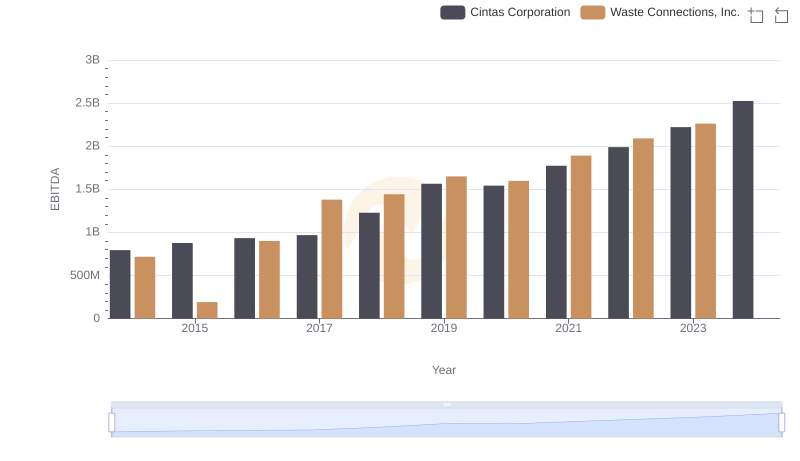
A Side-by-Side Analysis of EBITDA: Cintas Corporation and Waste Connections, Inc.