| __timestamp | Cintas Corporation | Verisk Analytics, Inc. |
|---|---|---|
| Wednesday, January 1, 2014 | 1302752000 | 227306000 |
| Thursday, January 1, 2015 | 1224930000 | 312690000 |
| Friday, January 1, 2016 | 1348122000 | 301600000 |
| Sunday, January 1, 2017 | 1527380000 | 322800000 |
| Monday, January 1, 2018 | 1916792000 | 378700000 |
| Tuesday, January 1, 2019 | 1980644000 | 603500000 |
| Wednesday, January 1, 2020 | 2071052000 | 413900000 |
| Friday, January 1, 2021 | 1929159000 | 422700000 |
| Saturday, January 1, 2022 | 2044876000 | 381500000 |
| Sunday, January 1, 2023 | 2370704000 | 389300000 |
| Monday, January 1, 2024 | 2617783000 |
Infusing magic into the data realm
In the competitive landscape of corporate America, understanding the financial health of companies is crucial. This analysis delves into the Selling, General, and Administrative (SG&A) expenses of Cintas Corporation and Verisk Analytics, Inc. over the past decade. From 2014 to 2023, Cintas Corporation has seen a remarkable 100% increase in SG&A expenses, reflecting its aggressive growth strategy and market expansion. In contrast, Verisk Analytics, Inc. experienced a more modest 71% rise, indicating a steady yet cautious approach to scaling operations.
Cintas's expenses peaked in 2024, with a notable jump of 23% from the previous year, while Verisk's data for 2024 remains unavailable, leaving room for speculation. This trend highlights the dynamic nature of corporate strategies and the varying approaches to managing operational costs. As businesses navigate the complexities of the modern economy, these insights offer a glimpse into their financial priorities and future trajectories.
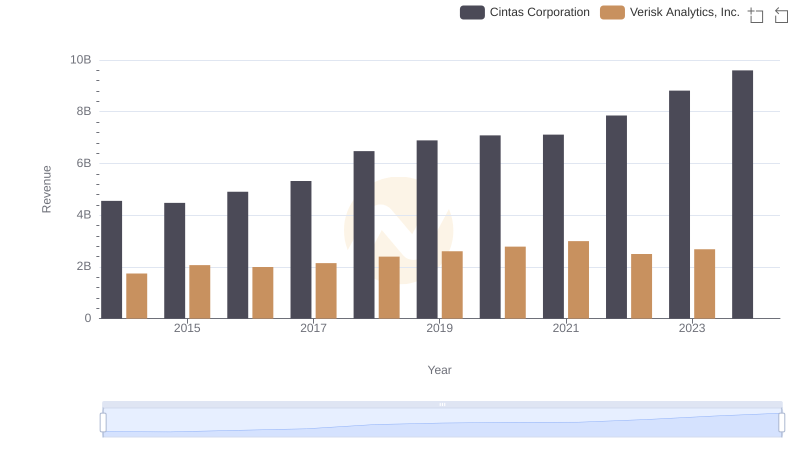
Comparing Revenue Performance: Cintas Corporation or Verisk Analytics, Inc.?
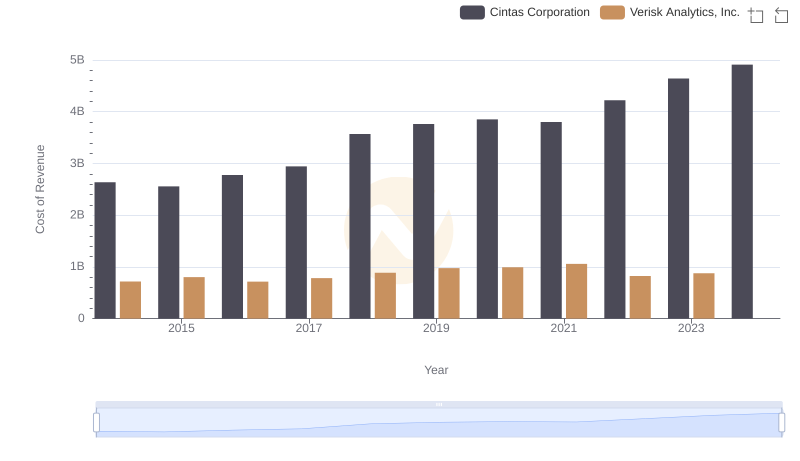
Cost Insights: Breaking Down Cintas Corporation and Verisk Analytics, Inc.'s Expenses
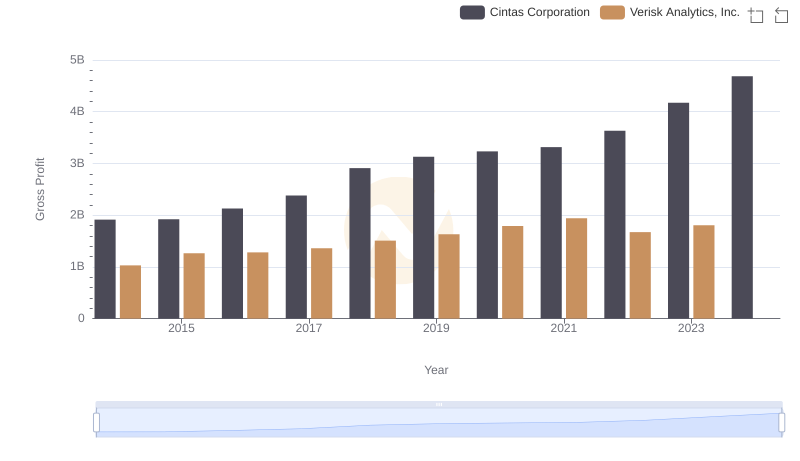
Cintas Corporation and Verisk Analytics, Inc.: A Detailed Gross Profit Analysis
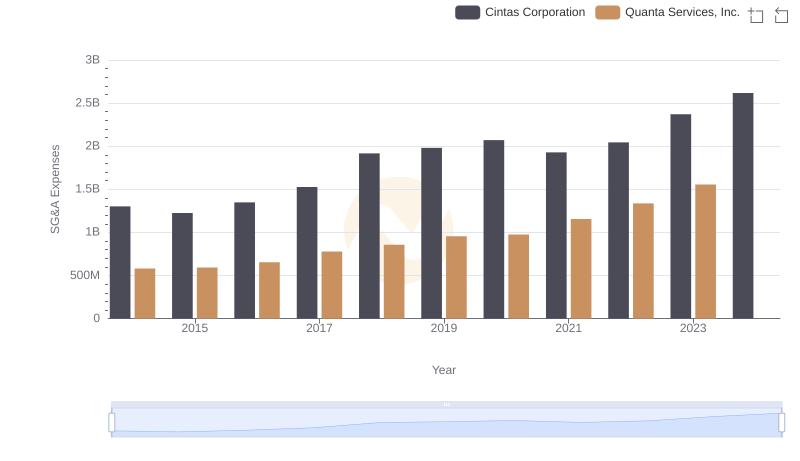
Who Optimizes SG&A Costs Better? Cintas Corporation or Quanta Services, Inc.
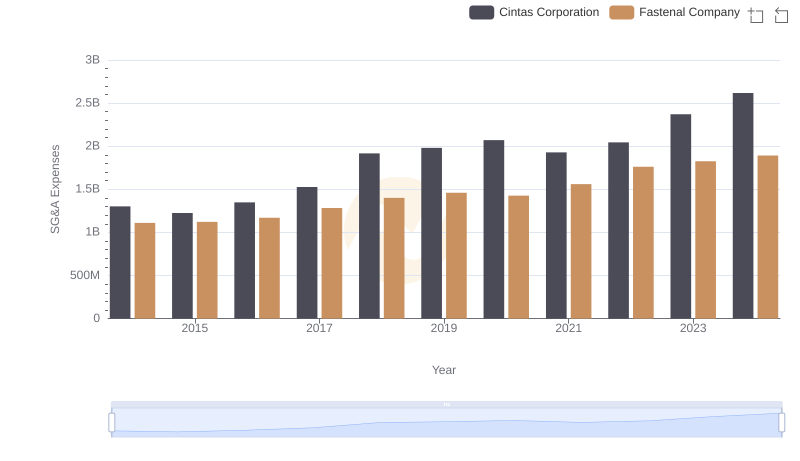
Cintas Corporation vs Fastenal Company: SG&A Expense Trends
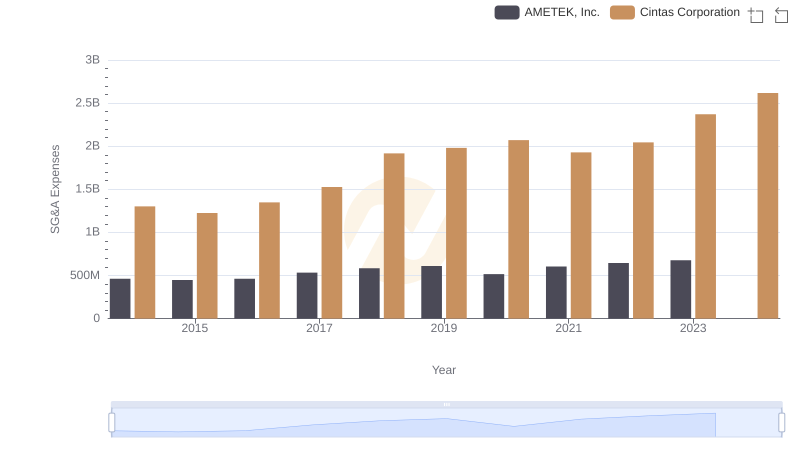
Cintas Corporation vs AMETEK, Inc.: SG&A Expense Trends
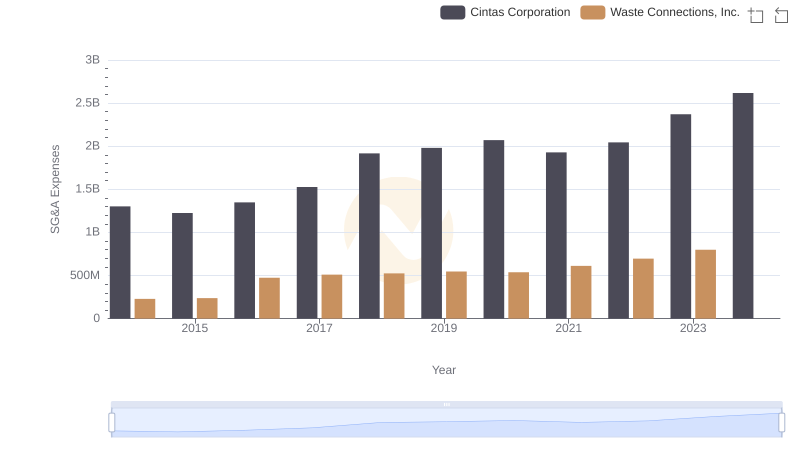
SG&A Efficiency Analysis: Comparing Cintas Corporation and Waste Connections, Inc.
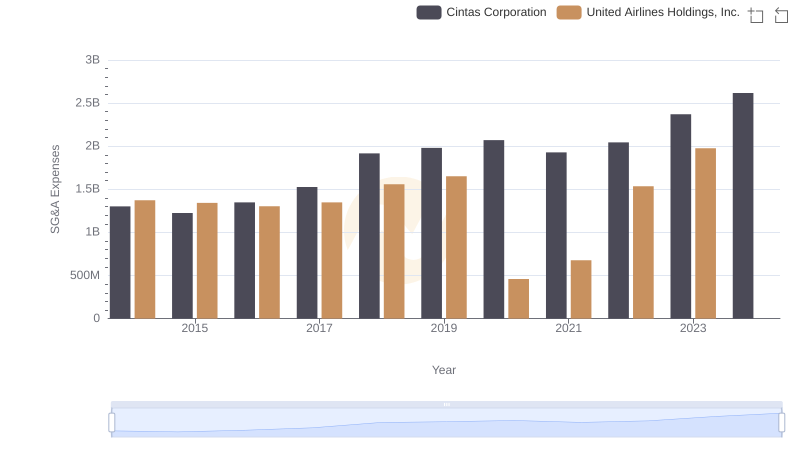
SG&A Efficiency Analysis: Comparing Cintas Corporation and United Airlines Holdings, Inc.
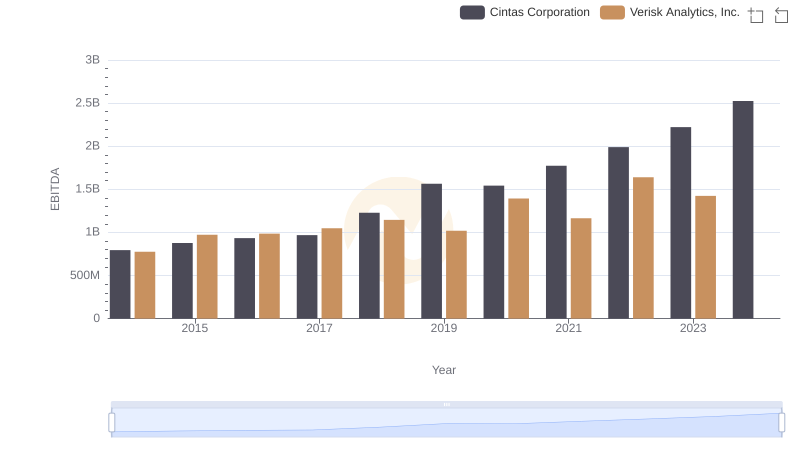
A Side-by-Side Analysis of EBITDA: Cintas Corporation and Verisk Analytics, Inc.
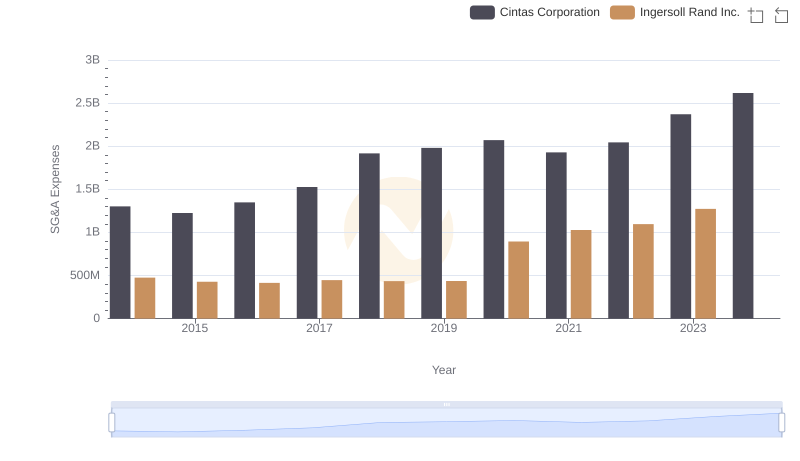
Cintas Corporation and Ingersoll Rand Inc.: SG&A Spending Patterns Compared
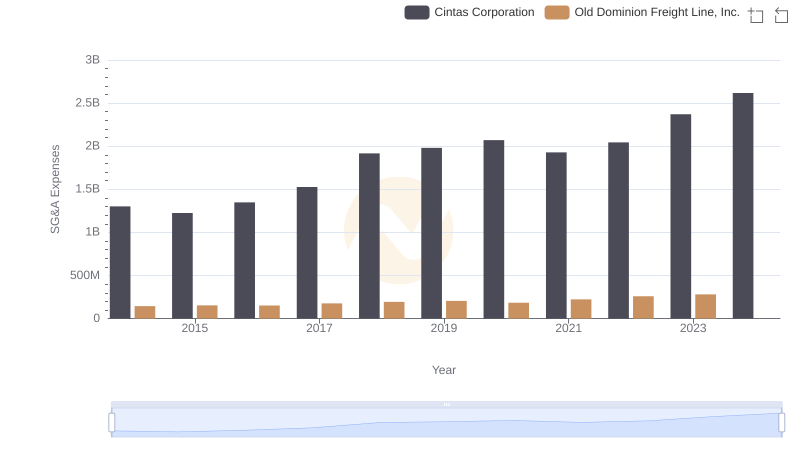
Selling, General, and Administrative Costs: Cintas Corporation vs Old Dominion Freight Line, Inc.