| __timestamp | Cintas Corporation | United Airlines Holdings, Inc. |
|---|---|---|
| Wednesday, January 1, 2014 | 4551812000 | 38901000000 |
| Thursday, January 1, 2015 | 4476886000 | 37864000000 |
| Friday, January 1, 2016 | 4905458000 | 36556000000 |
| Sunday, January 1, 2017 | 5323381000 | 37736000000 |
| Monday, January 1, 2018 | 6476632000 | 41303000000 |
| Tuesday, January 1, 2019 | 6892303000 | 43259000000 |
| Wednesday, January 1, 2020 | 7085120000 | 15355000000 |
| Friday, January 1, 2021 | 7116340000 | 24634000000 |
| Saturday, January 1, 2022 | 7854459000 | 44955000000 |
| Sunday, January 1, 2023 | 8815769000 | 53717000000 |
| Monday, January 1, 2024 | 9596615000 | 57063000000 |
Igniting the spark of knowledge
In the ever-evolving landscape of American business, Cintas Corporation and United Airlines Holdings, Inc. stand as titans in their respective industries. From 2014 to 2023, Cintas has demonstrated a robust growth trajectory, with revenue surging by approximately 111%, from $4.6 billion to $9.6 billion. This consistent upward trend underscores Cintas's strategic prowess in the corporate services sector.
Conversely, United Airlines experienced a more turbulent journey. While its revenue peaked at $53.7 billion in 2023, the airline faced significant challenges, particularly in 2020, when revenue plummeted to $15.4 billion due to the global pandemic. However, United's remarkable recovery, with a 250% increase from 2020 to 2023, highlights its resilience and adaptability in the face of adversity.
These insights reveal the dynamic nature of revenue trends, offering a glimpse into the strategic maneuvers of two industry leaders.
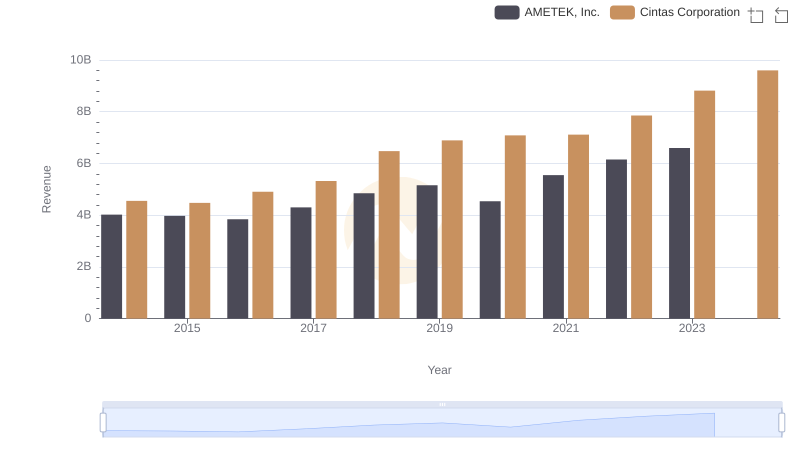
Cintas Corporation vs AMETEK, Inc.: Examining Key Revenue Metrics
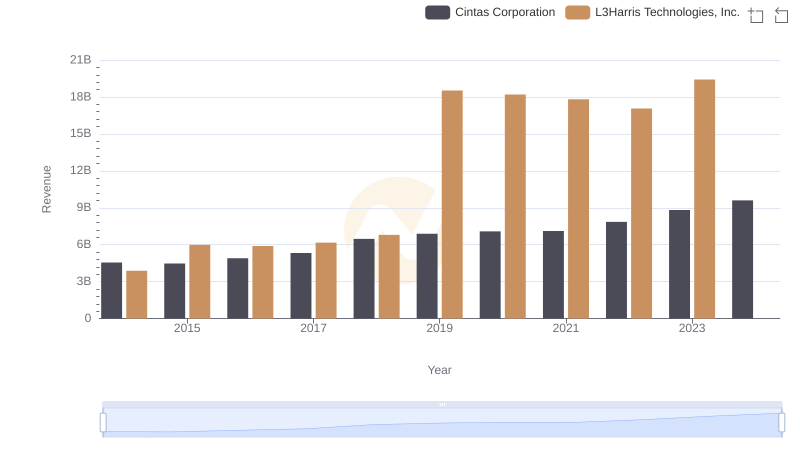
Cintas Corporation and L3Harris Technologies, Inc.: A Comprehensive Revenue Analysis
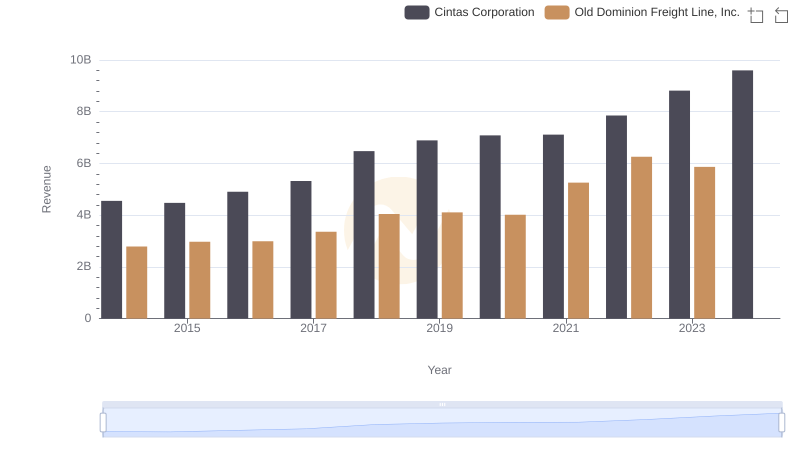
Revenue Insights: Cintas Corporation and Old Dominion Freight Line, Inc. Performance Compared
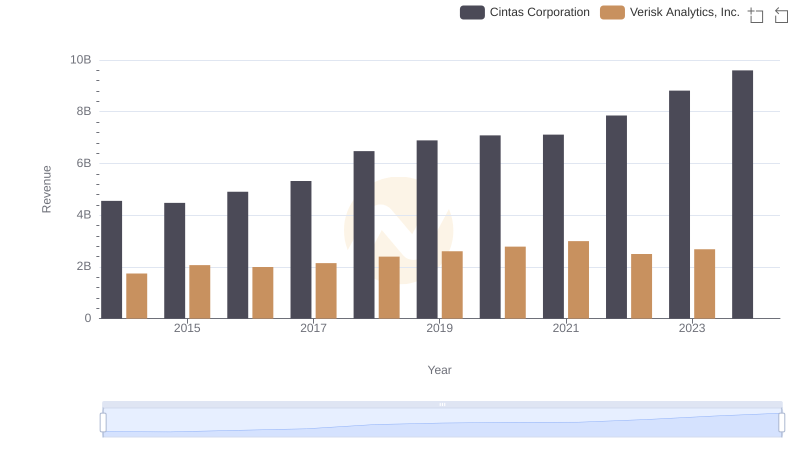
Comparing Revenue Performance: Cintas Corporation or Verisk Analytics, Inc.?
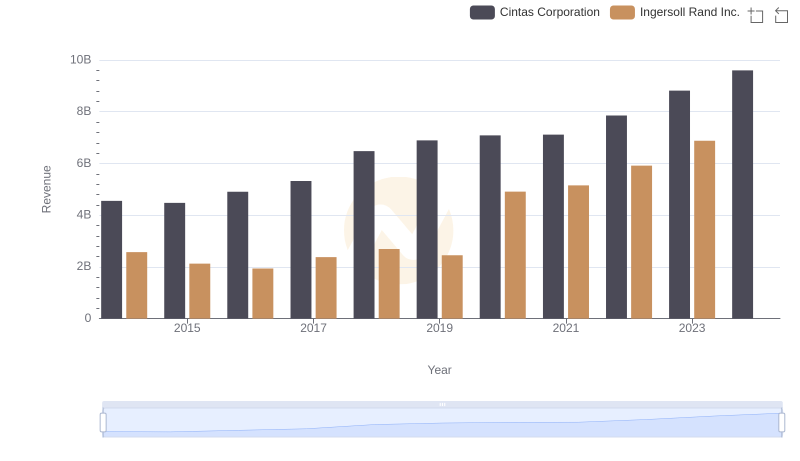
Revenue Showdown: Cintas Corporation vs Ingersoll Rand Inc.
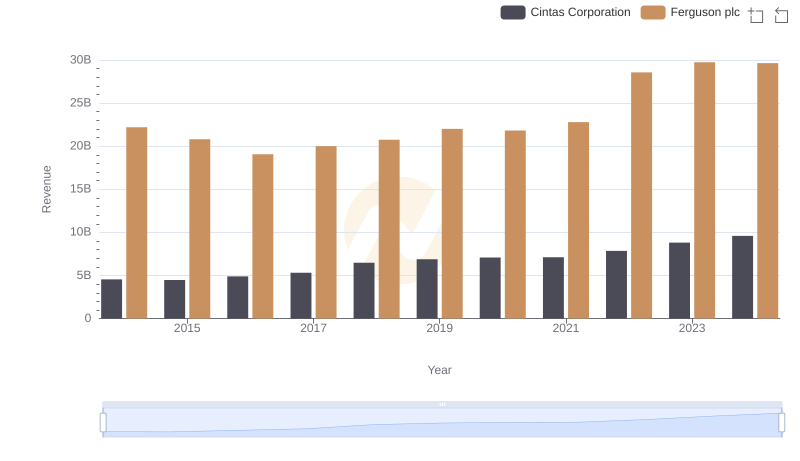
Who Generates More Revenue? Cintas Corporation or Ferguson plc
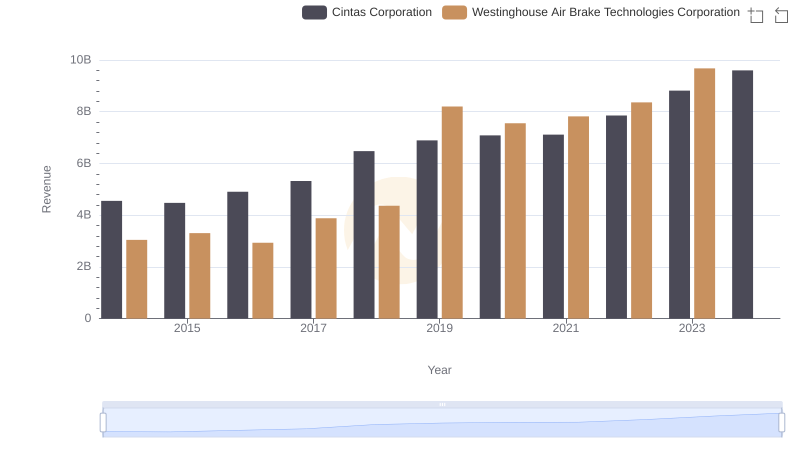
Revenue Showdown: Cintas Corporation vs Westinghouse Air Brake Technologies Corporation
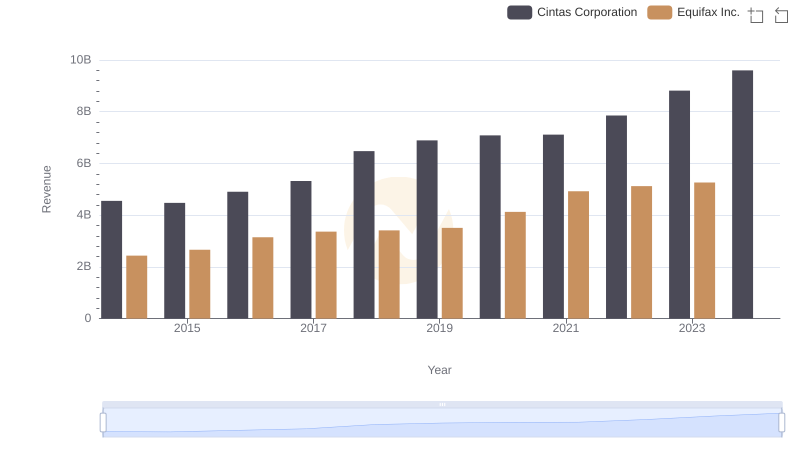
Cintas Corporation vs Equifax Inc.: Examining Key Revenue Metrics

Cintas Corporation vs United Airlines Holdings, Inc.: Efficiency in Cost of Revenue Explored
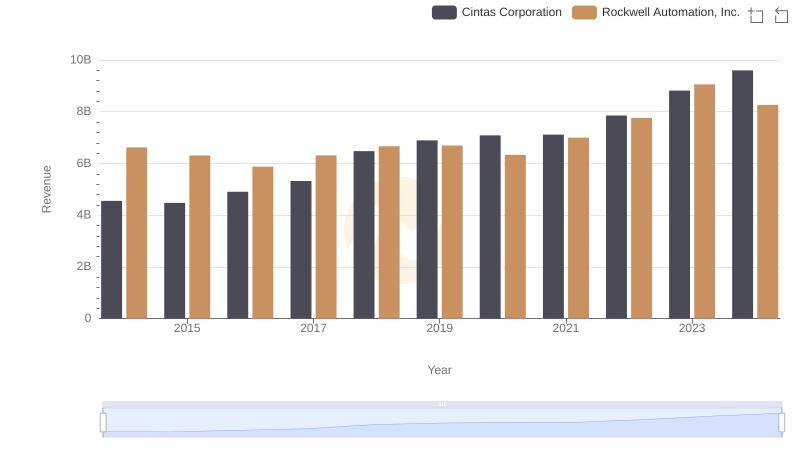
Who Generates More Revenue? Cintas Corporation or Rockwell Automation, Inc.
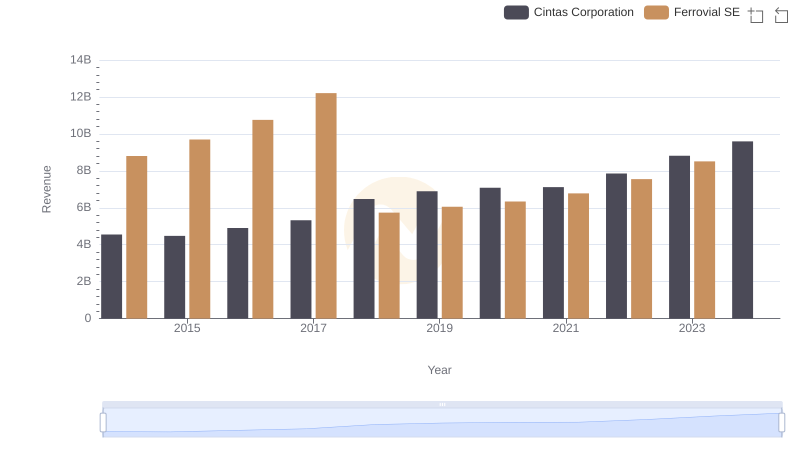
Cintas Corporation or Ferrovial SE: Who Leads in Yearly Revenue?
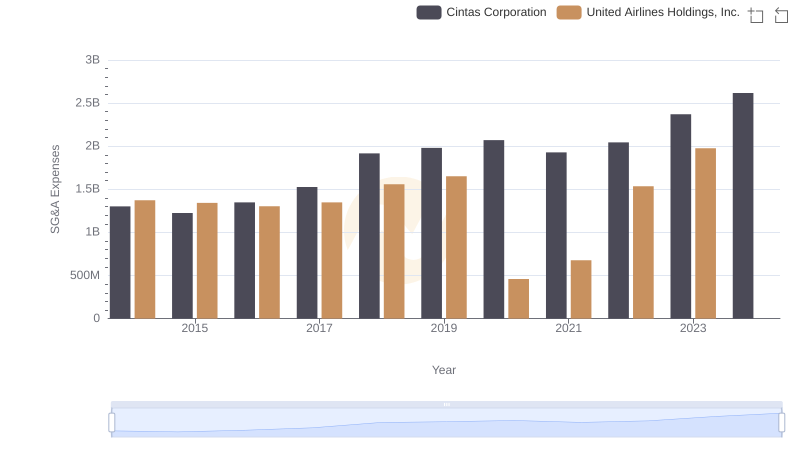
SG&A Efficiency Analysis: Comparing Cintas Corporation and United Airlines Holdings, Inc.