| __timestamp | Cintas Corporation | Ingersoll Rand Inc. |
|---|---|---|
| Wednesday, January 1, 2014 | 1302752000 | 476000000 |
| Thursday, January 1, 2015 | 1224930000 | 427000000 |
| Friday, January 1, 2016 | 1348122000 | 414339000 |
| Sunday, January 1, 2017 | 1527380000 | 446600000 |
| Monday, January 1, 2018 | 1916792000 | 434600000 |
| Tuesday, January 1, 2019 | 1980644000 | 436400000 |
| Wednesday, January 1, 2020 | 2071052000 | 894800000 |
| Friday, January 1, 2021 | 1929159000 | 1028000000 |
| Saturday, January 1, 2022 | 2044876000 | 1095800000 |
| Sunday, January 1, 2023 | 2370704000 | 1272700000 |
| Monday, January 1, 2024 | 2617783000 | 0 |
Cracking the code
In the competitive landscape of corporate America, understanding spending patterns is crucial. Cintas Corporation and Ingersoll Rand Inc. offer a fascinating glimpse into their financial strategies through their Selling, General, and Administrative (SG&A) expenses from 2014 to 2023.
Cintas Corporation has shown a consistent upward trend in SG&A expenses, with a remarkable 100% increase over the decade, peaking at approximately $2.62 billion in 2024. This growth reflects their aggressive expansion and investment in operational efficiency. In contrast, Ingersoll Rand Inc. experienced a more modest 167% increase, reaching around $1.27 billion in 2023. This suggests a more conservative approach, possibly focusing on cost control and strategic investments.
Interestingly, data for Ingersoll Rand Inc. in 2024 is missing, leaving room for speculation on their future financial maneuvers. As these giants continue to evolve, their SG&A spending will remain a key indicator of their strategic priorities.
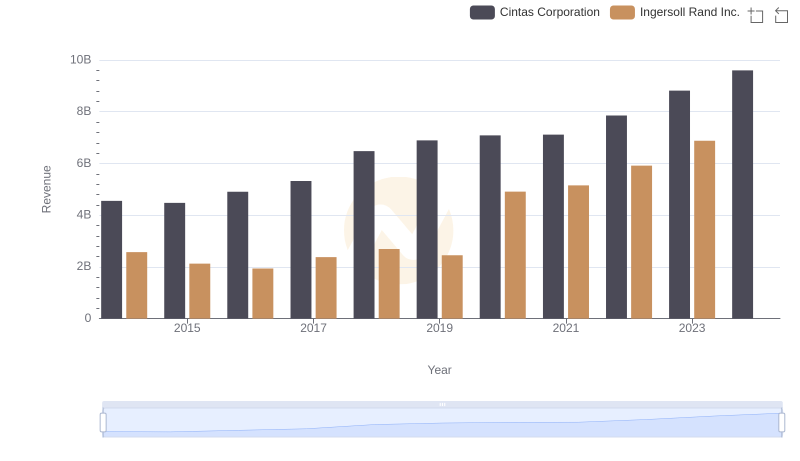
Revenue Showdown: Cintas Corporation vs Ingersoll Rand Inc.
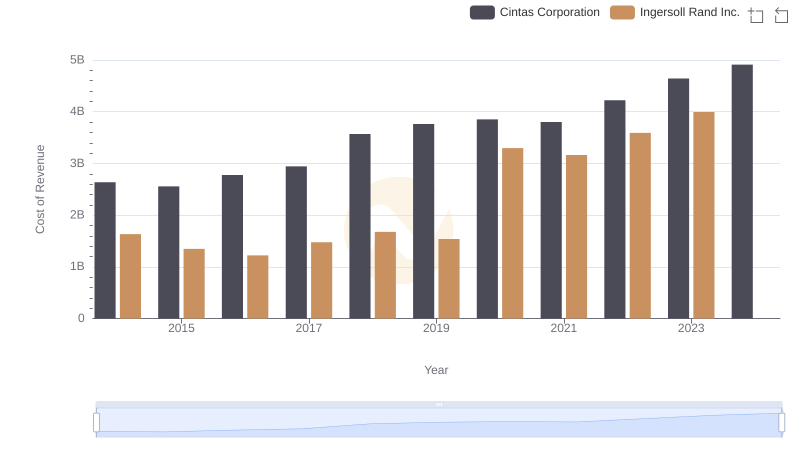
Cost Insights: Breaking Down Cintas Corporation and Ingersoll Rand Inc.'s Expenses
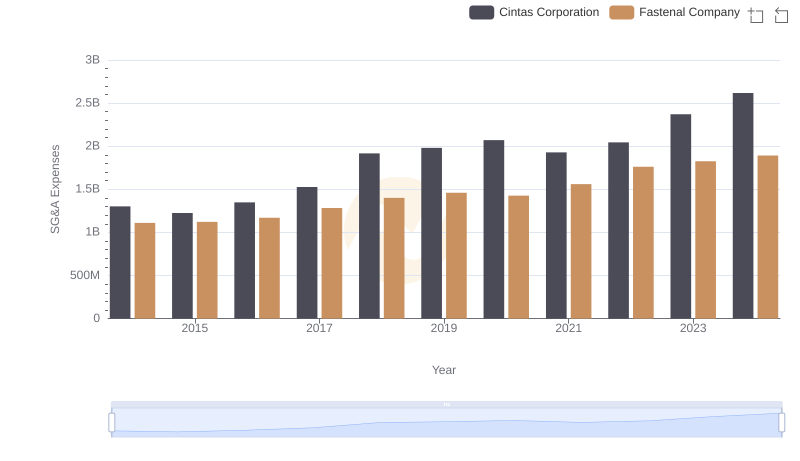
Cintas Corporation vs Fastenal Company: SG&A Expense Trends
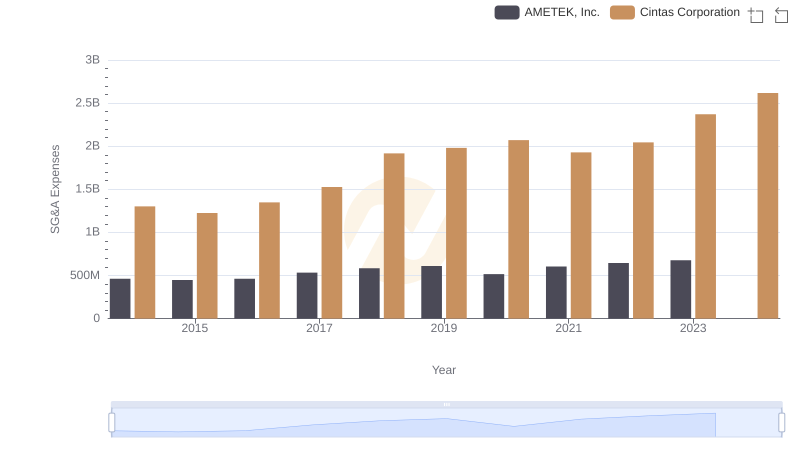
Cintas Corporation vs AMETEK, Inc.: SG&A Expense Trends
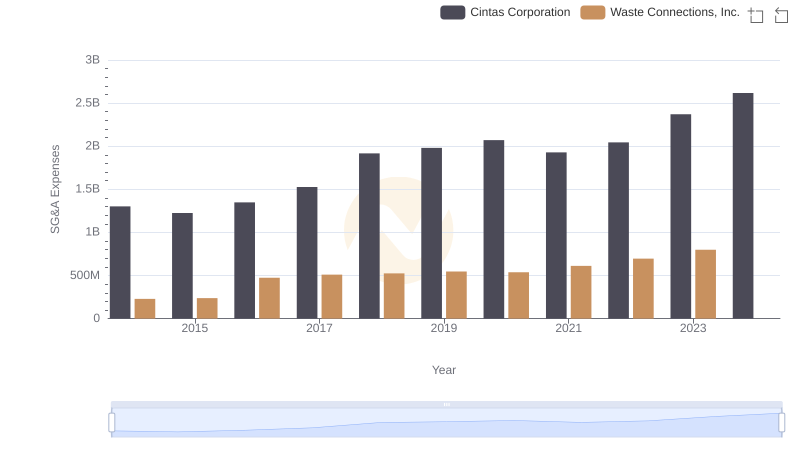
SG&A Efficiency Analysis: Comparing Cintas Corporation and Waste Connections, Inc.
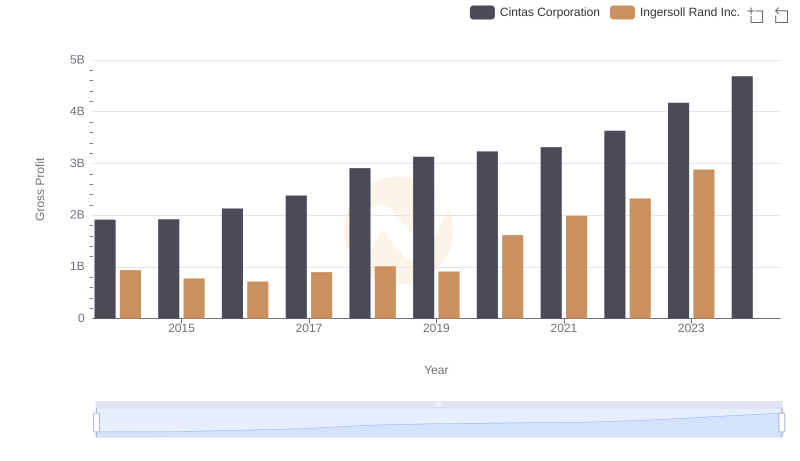
Gross Profit Trends Compared: Cintas Corporation vs Ingersoll Rand Inc.
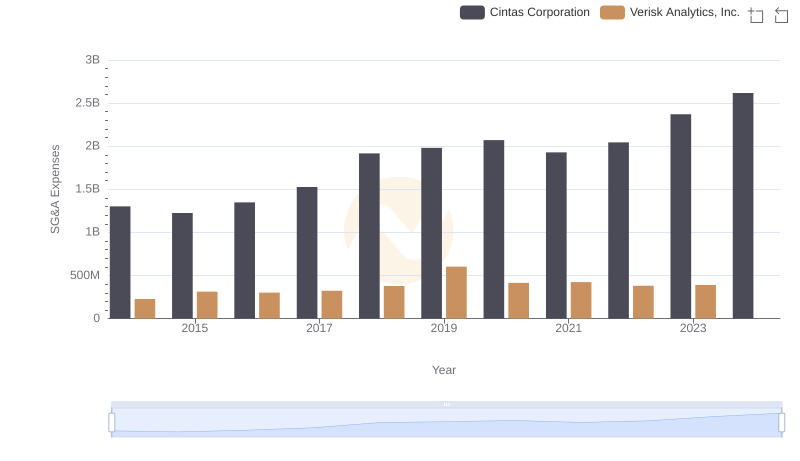
Cintas Corporation vs Verisk Analytics, Inc.: SG&A Expense Trends
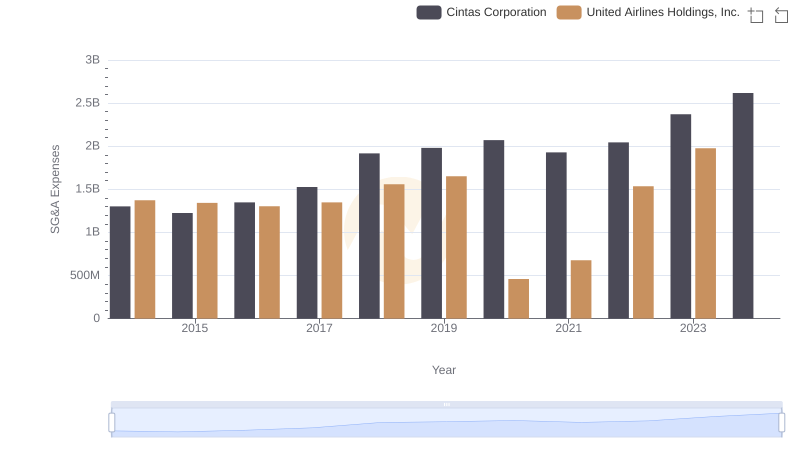
SG&A Efficiency Analysis: Comparing Cintas Corporation and United Airlines Holdings, Inc.
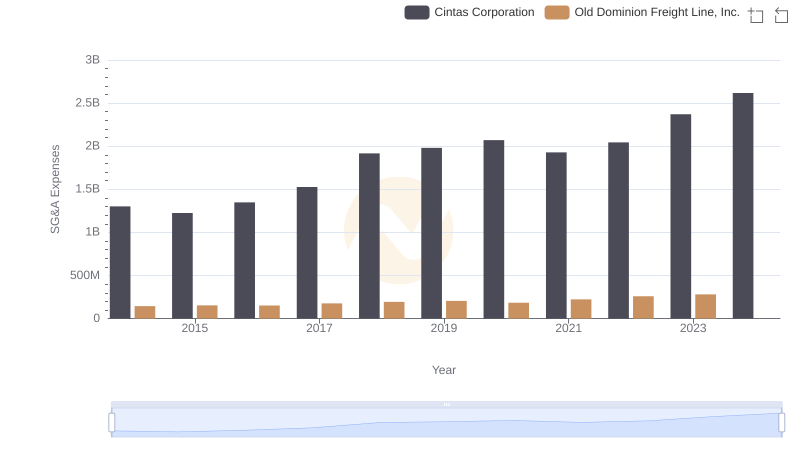
Selling, General, and Administrative Costs: Cintas Corporation vs Old Dominion Freight Line, Inc.
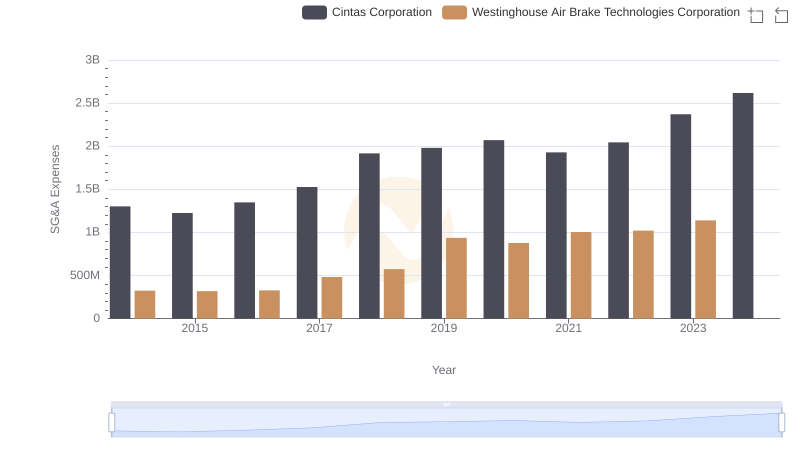
Cintas Corporation vs Westinghouse Air Brake Technologies Corporation: SG&A Expense Trends
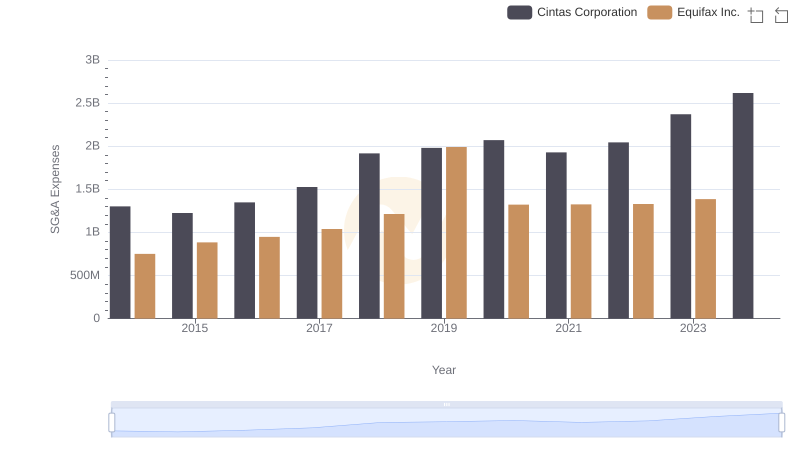
Breaking Down SG&A Expenses: Cintas Corporation vs Equifax Inc.