| __timestamp | AMETEK, Inc. | Cintas Corporation |
|---|---|---|
| Wednesday, January 1, 2014 | 462637000 | 1302752000 |
| Thursday, January 1, 2015 | 448592000 | 1224930000 |
| Friday, January 1, 2016 | 462970000 | 1348122000 |
| Sunday, January 1, 2017 | 533645000 | 1527380000 |
| Monday, January 1, 2018 | 584022000 | 1916792000 |
| Tuesday, January 1, 2019 | 610280000 | 1980644000 |
| Wednesday, January 1, 2020 | 515630000 | 2071052000 |
| Friday, January 1, 2021 | 603944000 | 1929159000 |
| Saturday, January 1, 2022 | 644577000 | 2044876000 |
| Sunday, January 1, 2023 | 677006000 | 2370704000 |
| Monday, January 1, 2024 | 696905000 | 2617783000 |
Data in motion
In the competitive landscape of corporate America, understanding the financial health of companies is crucial. This analysis delves into the Selling, General, and Administrative (SG&A) expenses of two industry giants: Cintas Corporation and AMETEK, Inc., from 2014 to 2023.
Over the past decade, Cintas Corporation has consistently outpaced AMETEK, Inc. in SG&A expenses, reflecting its expansive operational scale. In 2023, Cintas reported a 19% increase in SG&A expenses compared to 2022, reaching a peak of approximately $2.37 billion. Meanwhile, AMETEK's expenses grew by 5% in the same period, totaling around $677 million.
Cintas's expenses have shown a steady upward trend, with a notable 100% increase since 2014. In contrast, AMETEK's growth has been more modest, with a 46% rise over the same period. This disparity highlights Cintas's aggressive growth strategy and market expansion.
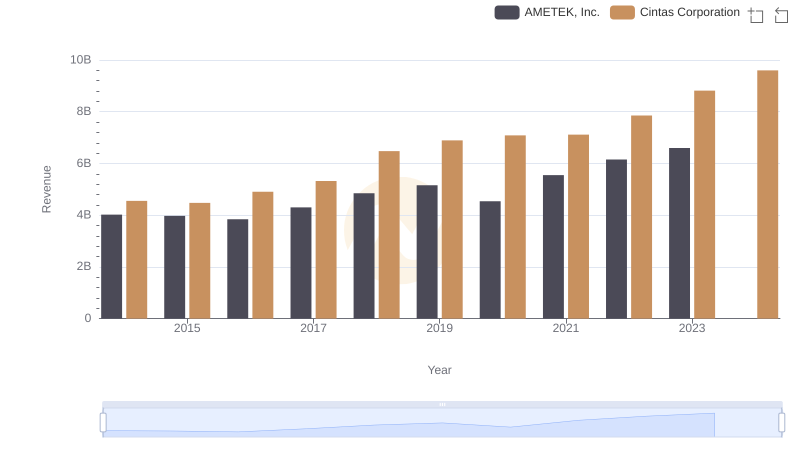
Cintas Corporation vs AMETEK, Inc.: Examining Key Revenue Metrics
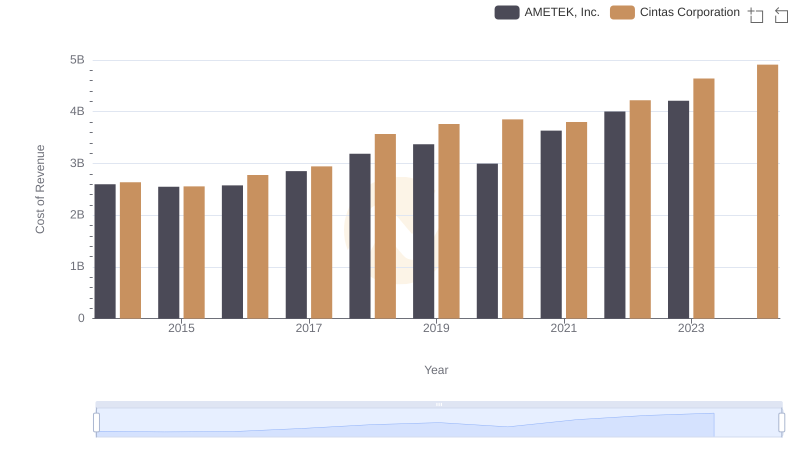
Analyzing Cost of Revenue: Cintas Corporation and AMETEK, Inc.
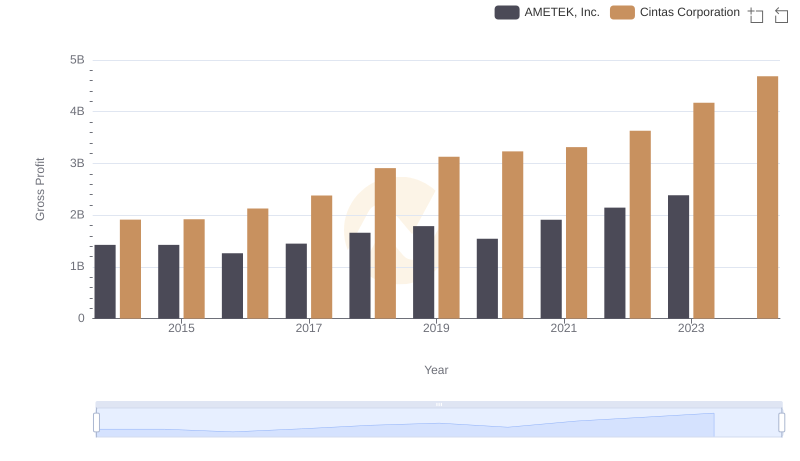
Cintas Corporation vs AMETEK, Inc.: A Gross Profit Performance Breakdown
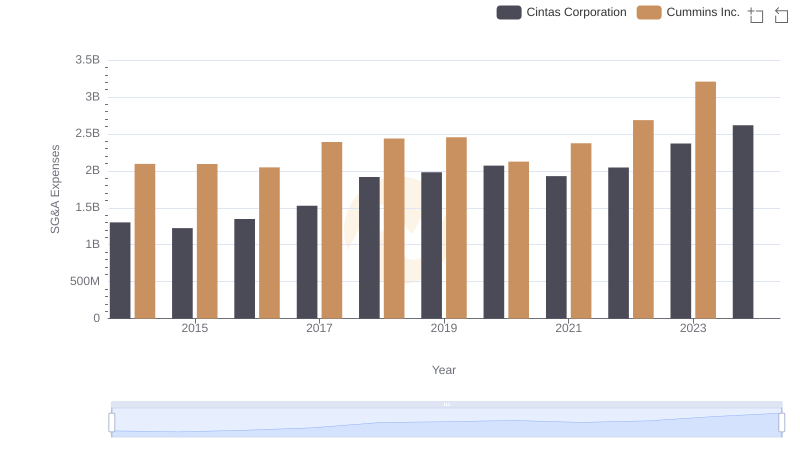
Breaking Down SG&A Expenses: Cintas Corporation vs Cummins Inc.
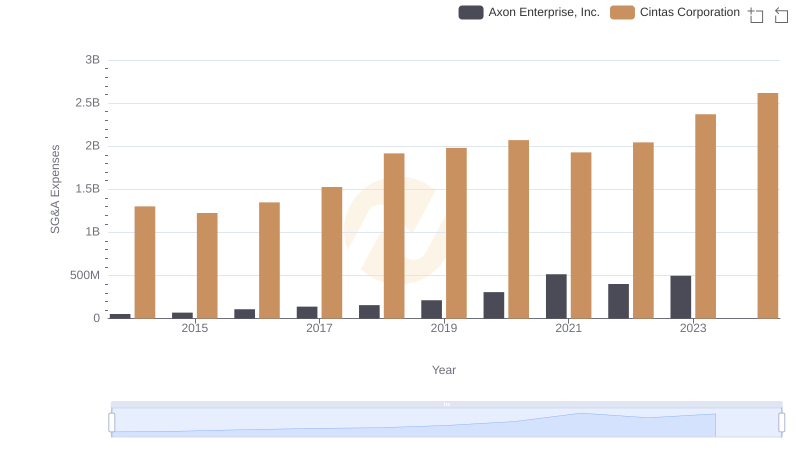
Cintas Corporation and Axon Enterprise, Inc.: SG&A Spending Patterns Compared
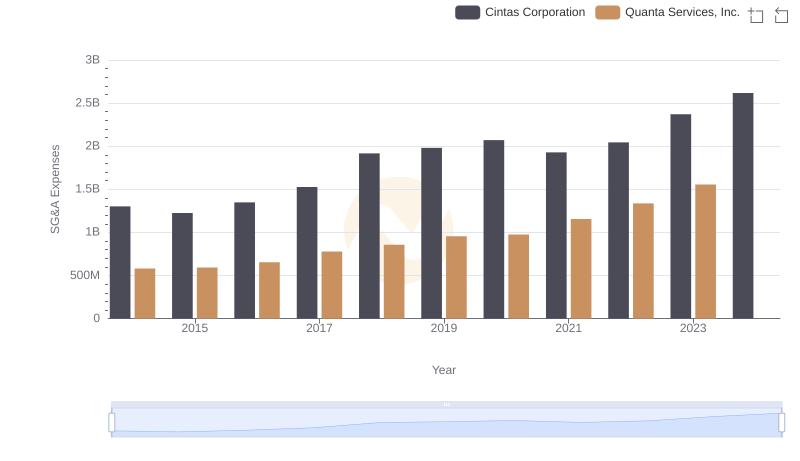
Who Optimizes SG&A Costs Better? Cintas Corporation or Quanta Services, Inc.
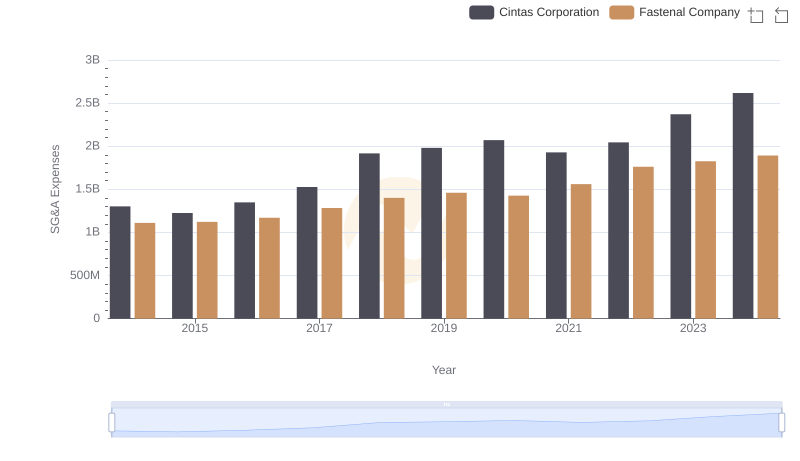
Cintas Corporation vs Fastenal Company: SG&A Expense Trends
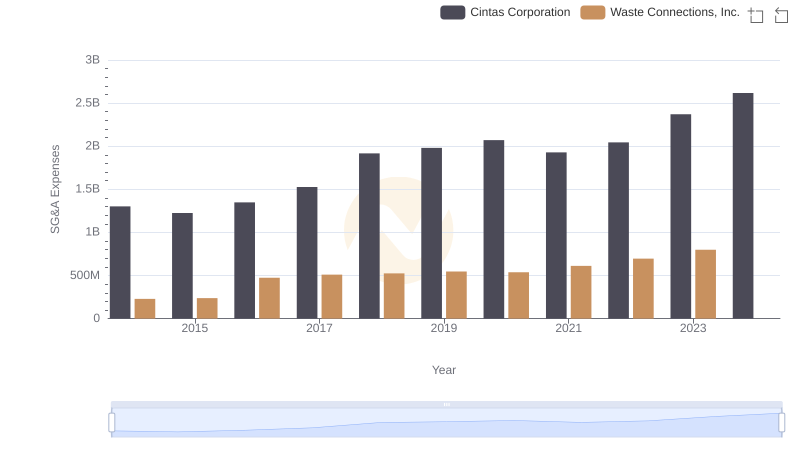
SG&A Efficiency Analysis: Comparing Cintas Corporation and Waste Connections, Inc.
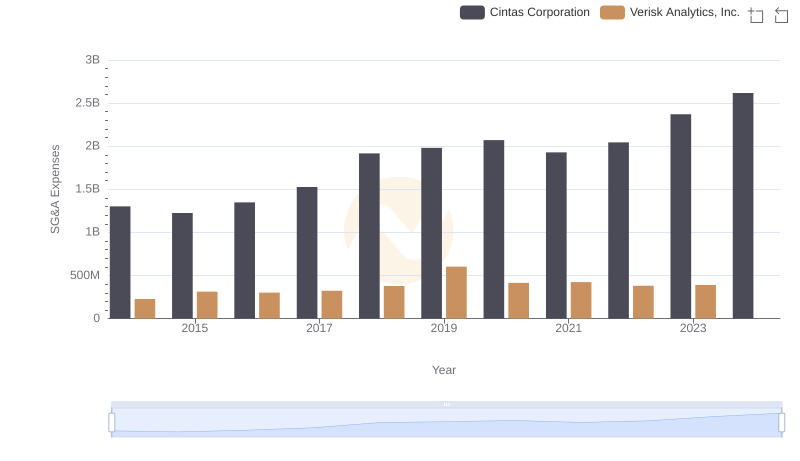
Cintas Corporation vs Verisk Analytics, Inc.: SG&A Expense Trends
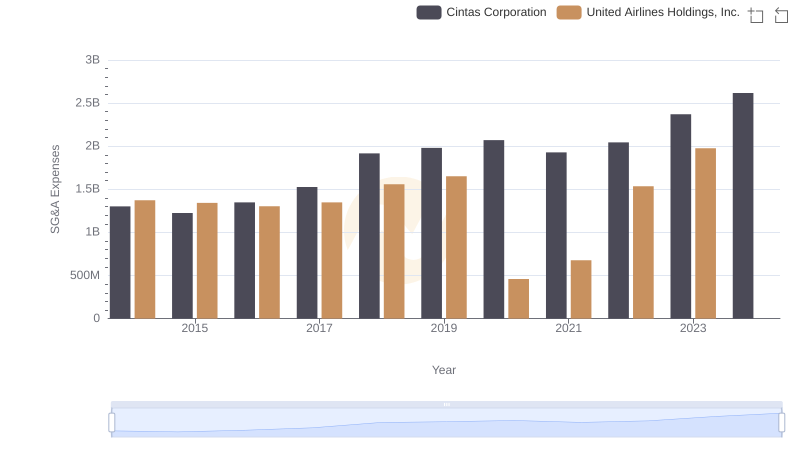
SG&A Efficiency Analysis: Comparing Cintas Corporation and United Airlines Holdings, Inc.
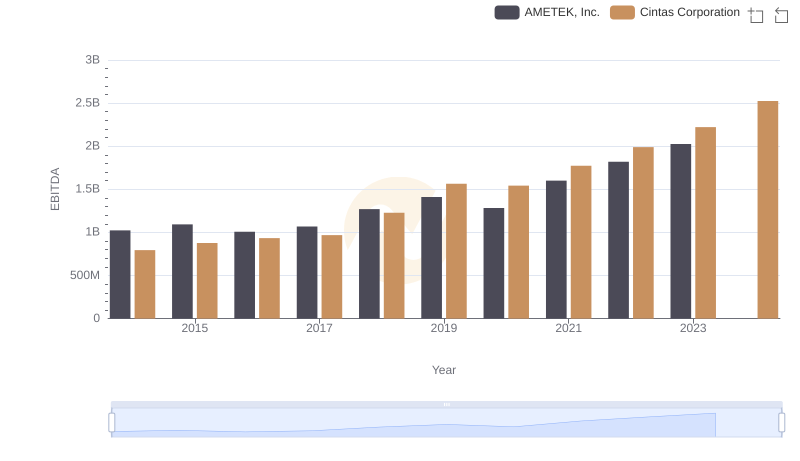
Cintas Corporation vs AMETEK, Inc.: In-Depth EBITDA Performance Comparison