| __timestamp | Axon Enterprise, Inc. | Cintas Corporation |
|---|---|---|
| Wednesday, January 1, 2014 | 54158000 | 1302752000 |
| Thursday, January 1, 2015 | 69698000 | 1224930000 |
| Friday, January 1, 2016 | 108076000 | 1348122000 |
| Sunday, January 1, 2017 | 138692000 | 1527380000 |
| Monday, January 1, 2018 | 156886000 | 1916792000 |
| Tuesday, January 1, 2019 | 212959000 | 1980644000 |
| Wednesday, January 1, 2020 | 307286000 | 2071052000 |
| Friday, January 1, 2021 | 515007000 | 1929159000 |
| Saturday, January 1, 2022 | 401575000 | 2044876000 |
| Sunday, January 1, 2023 | 496874000 | 2370704000 |
| Monday, January 1, 2024 | 2617783000 |
Unleashing insights
In the competitive landscape of corporate America, understanding spending patterns can offer valuable insights into a company's strategic priorities. Cintas Corporation and Axon Enterprise, Inc. provide a fascinating case study in contrasting approaches to Selling, General, and Administrative (SG&A) expenses over the past decade.
From 2014 to 2023, Cintas consistently allocated a significant portion of its budget to SG&A, with a notable increase of approximately 82% over the period. This steady rise reflects Cintas's commitment to maintaining robust administrative and sales operations. In contrast, Axon Enterprise, Inc. exhibited a more volatile pattern, with a dramatic surge in SG&A expenses, peaking in 2021 with a 850% increase from 2014. This fluctuation suggests a dynamic strategy, possibly driven by aggressive market expansion and innovation.
Interestingly, while Cintas's SG&A spending continued to grow into 2024, Axon's data for the same year remains unavailable, leaving room for speculation on its future trajectory.
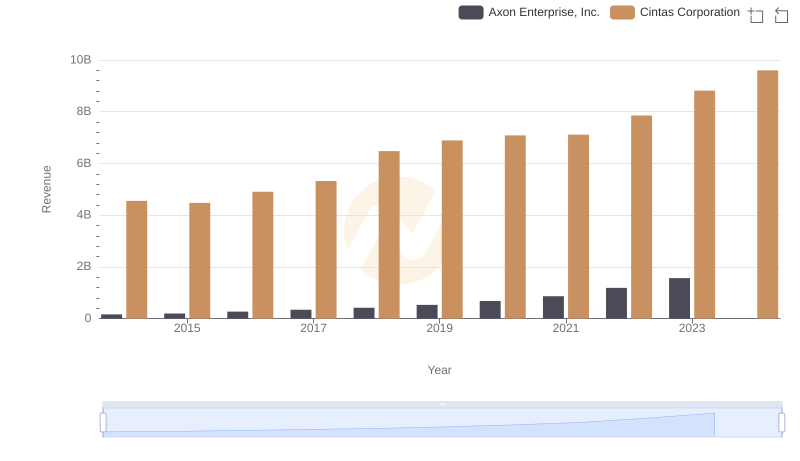
Cintas Corporation vs Axon Enterprise, Inc.: Annual Revenue Growth Compared
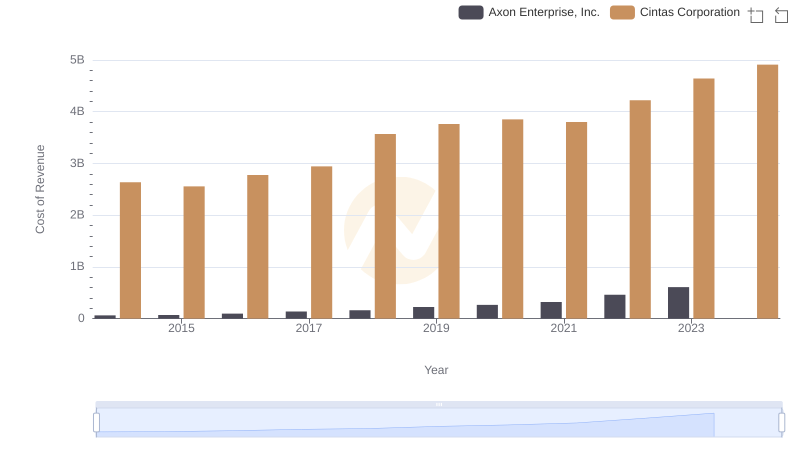
Cost of Revenue: Key Insights for Cintas Corporation and Axon Enterprise, Inc.
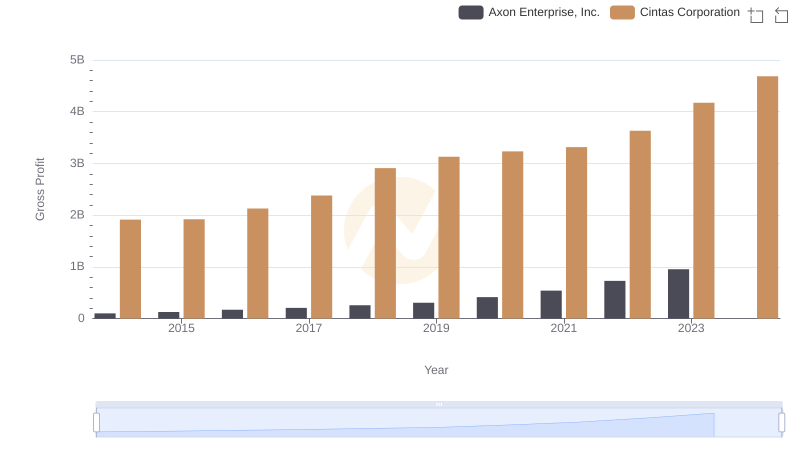
Key Insights on Gross Profit: Cintas Corporation vs Axon Enterprise, Inc.
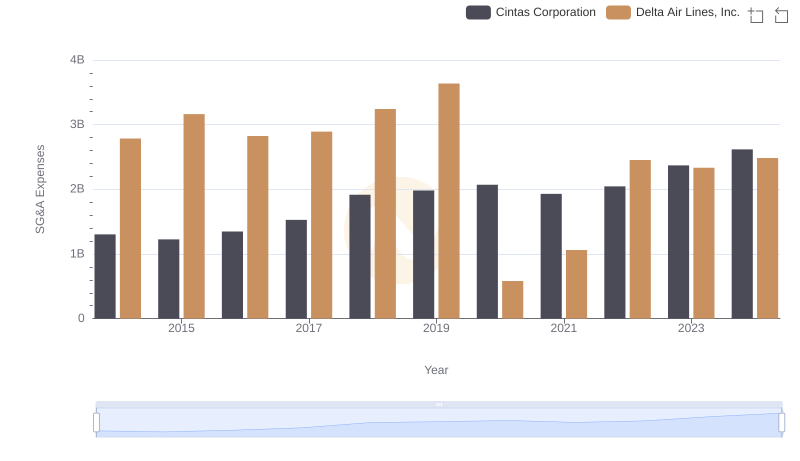
Cost Management Insights: SG&A Expenses for Cintas Corporation and Delta Air Lines, Inc.
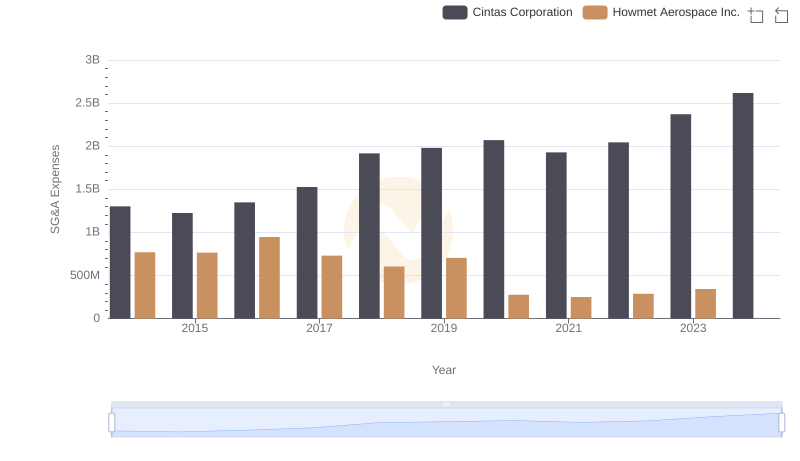
Who Optimizes SG&A Costs Better? Cintas Corporation or Howmet Aerospace Inc.
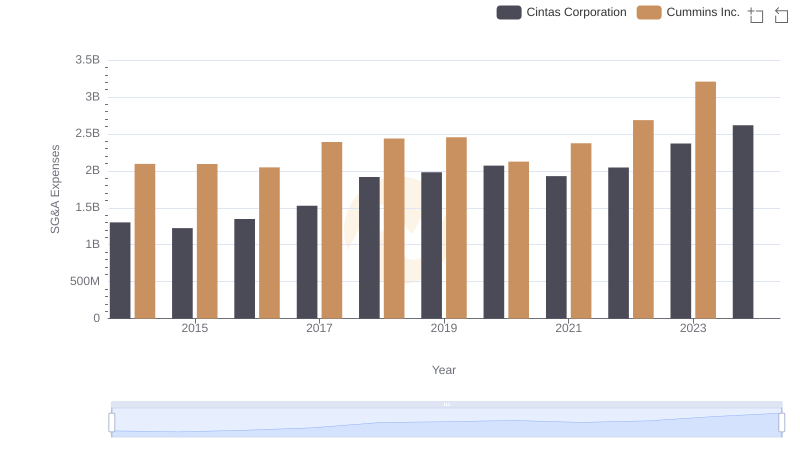
Breaking Down SG&A Expenses: Cintas Corporation vs Cummins Inc.
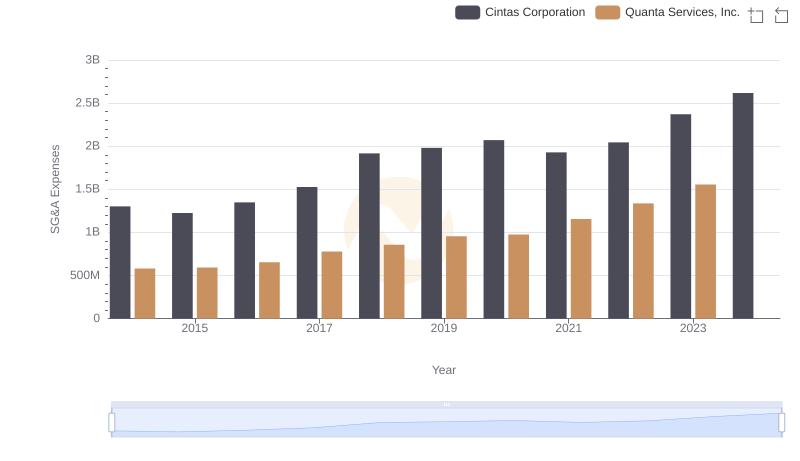
Who Optimizes SG&A Costs Better? Cintas Corporation or Quanta Services, Inc.
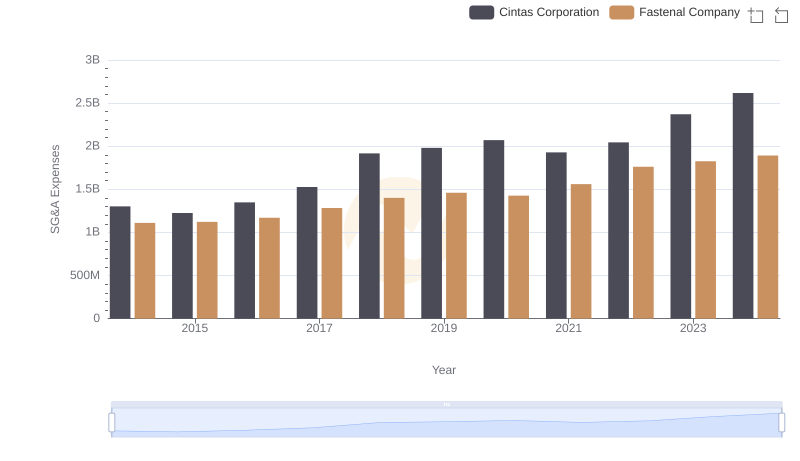
Cintas Corporation vs Fastenal Company: SG&A Expense Trends
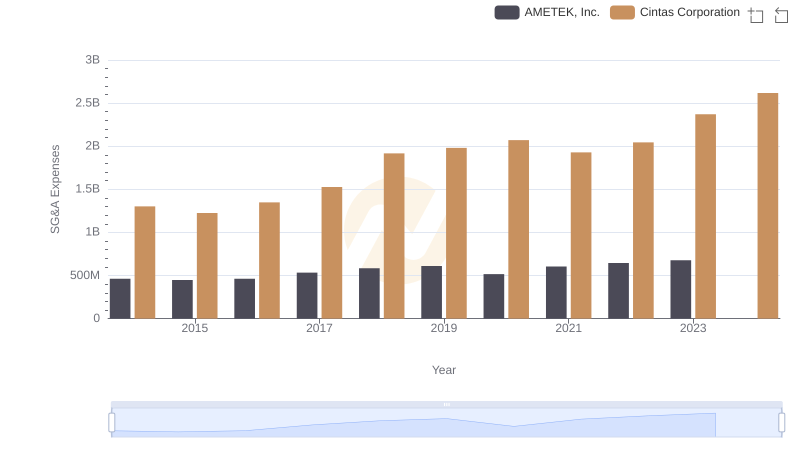
Cintas Corporation vs AMETEK, Inc.: SG&A Expense Trends
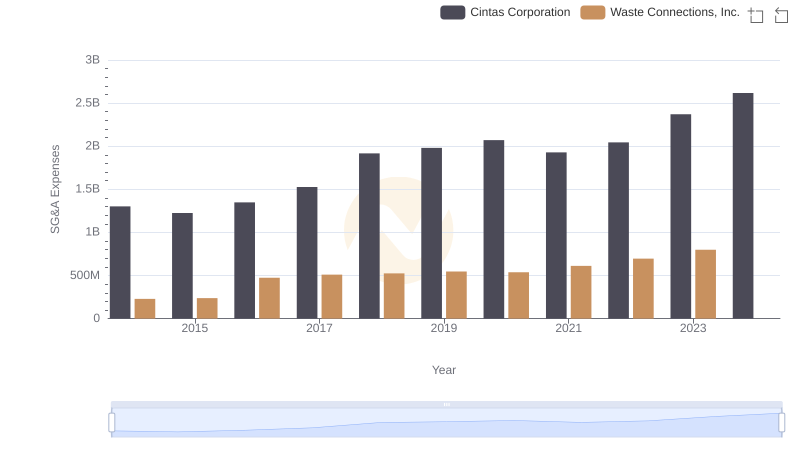
SG&A Efficiency Analysis: Comparing Cintas Corporation and Waste Connections, Inc.
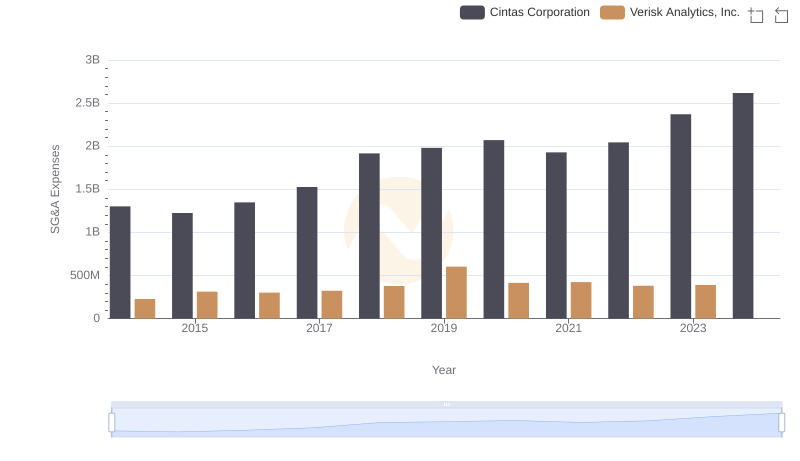
Cintas Corporation vs Verisk Analytics, Inc.: SG&A Expense Trends
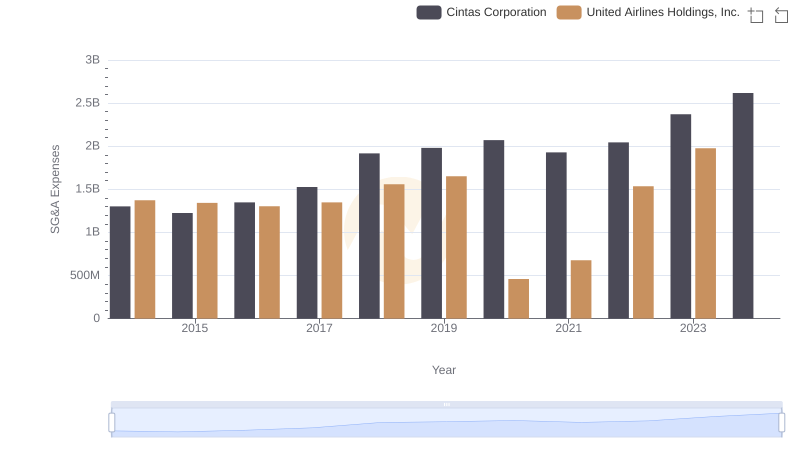
SG&A Efficiency Analysis: Comparing Cintas Corporation and United Airlines Holdings, Inc.