| __timestamp | Cintas Corporation | Fastenal Company |
|---|---|---|
| Wednesday, January 1, 2014 | 1302752000 | 1110776000 |
| Thursday, January 1, 2015 | 1224930000 | 1121590000 |
| Friday, January 1, 2016 | 1348122000 | 1169470000 |
| Sunday, January 1, 2017 | 1527380000 | 1282800000 |
| Monday, January 1, 2018 | 1916792000 | 1400200000 |
| Tuesday, January 1, 2019 | 1980644000 | 1459400000 |
| Wednesday, January 1, 2020 | 2071052000 | 1427400000 |
| Friday, January 1, 2021 | 1929159000 | 1559800000 |
| Saturday, January 1, 2022 | 2044876000 | 1762200000 |
| Sunday, January 1, 2023 | 2370704000 | 1825800000 |
| Monday, January 1, 2024 | 2617783000 | 1891900000 |
Unleashing the power of data
In the competitive landscape of industrial services, understanding the financial dynamics of key players is crucial. Over the past decade, Cintas Corporation and Fastenal Company have shown distinct trends in their Selling, General, and Administrative (SG&A) expenses. From 2014 to 2024, Cintas Corporation's SG&A expenses have surged by approximately 101%, reflecting a strategic expansion and increased operational costs. In contrast, Fastenal Company has experienced a more modest increase of around 70% in the same period, indicating a more conservative growth strategy.
These trends offer a window into the strategic priorities of these industry giants, with Cintas focusing on rapid expansion and Fastenal maintaining steady growth.
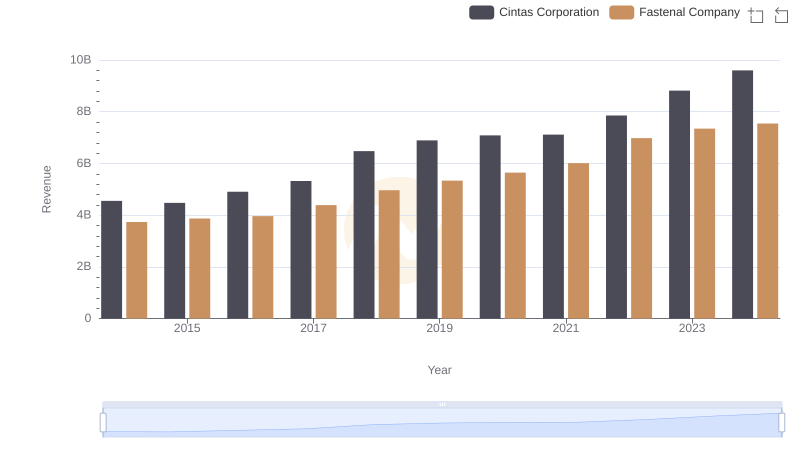
Cintas Corporation vs Fastenal Company: Examining Key Revenue Metrics
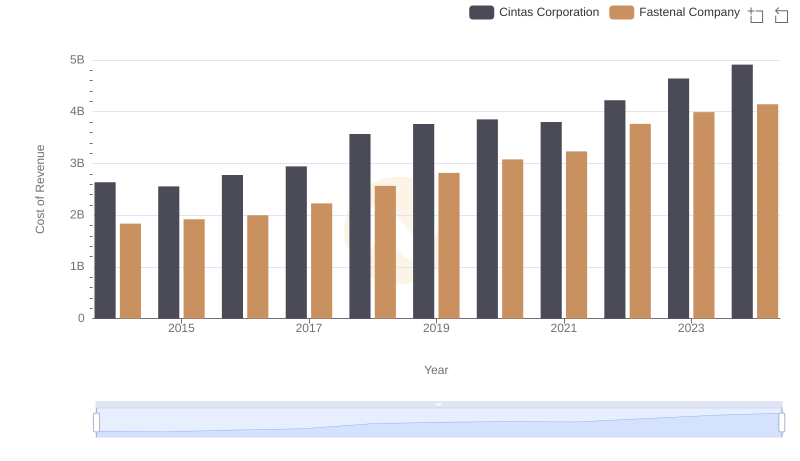
Cost of Revenue Trends: Cintas Corporation vs Fastenal Company
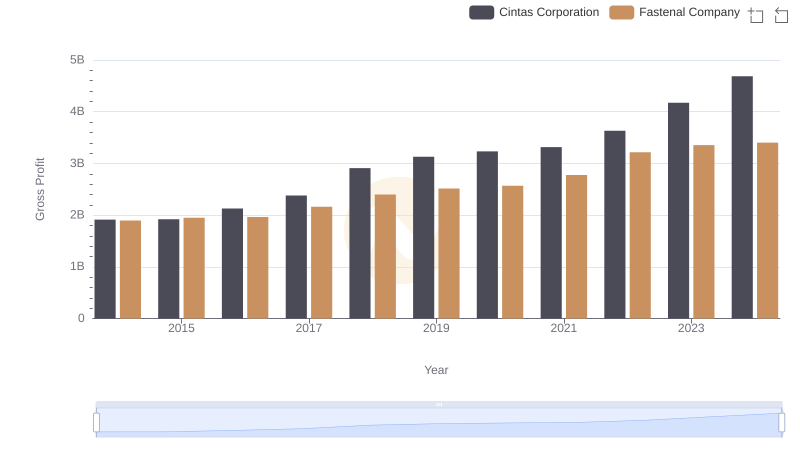
Key Insights on Gross Profit: Cintas Corporation vs Fastenal Company
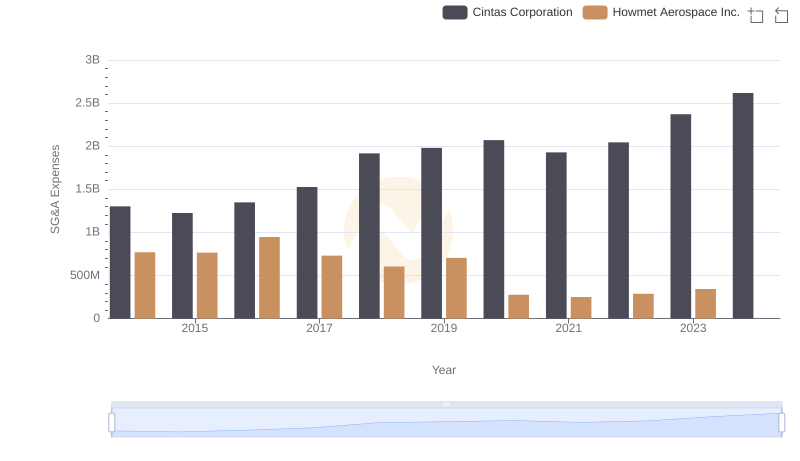
Who Optimizes SG&A Costs Better? Cintas Corporation or Howmet Aerospace Inc.
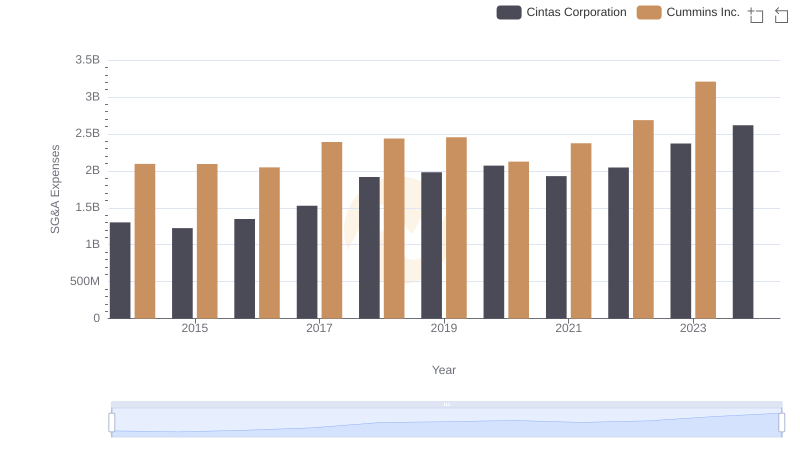
Breaking Down SG&A Expenses: Cintas Corporation vs Cummins Inc.
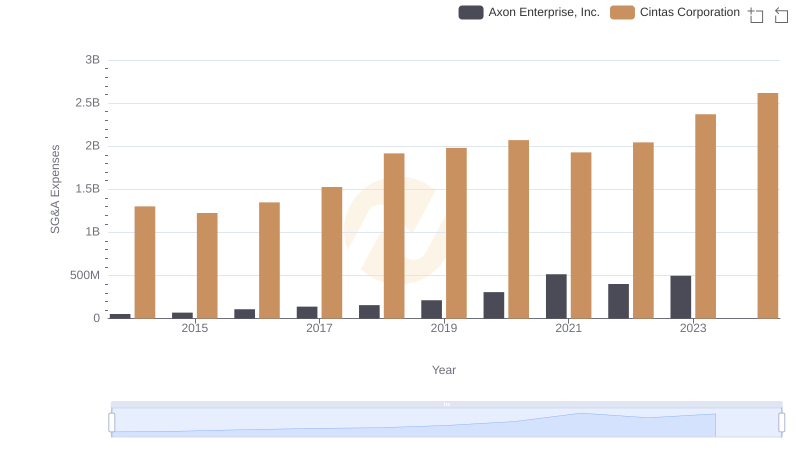
Cintas Corporation and Axon Enterprise, Inc.: SG&A Spending Patterns Compared
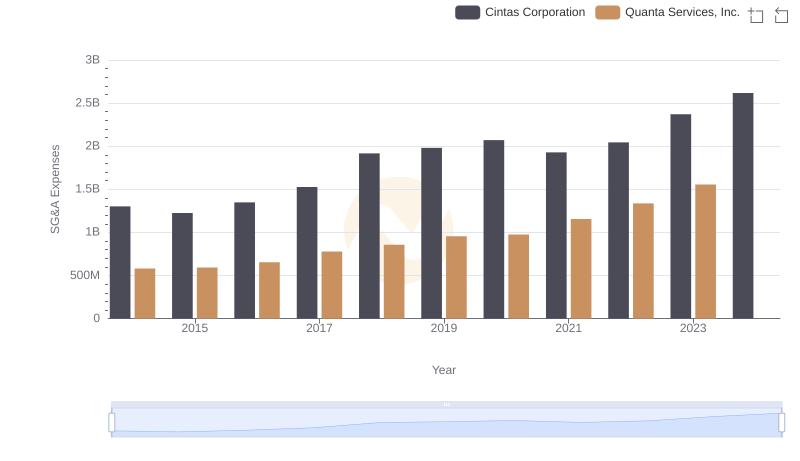
Who Optimizes SG&A Costs Better? Cintas Corporation or Quanta Services, Inc.
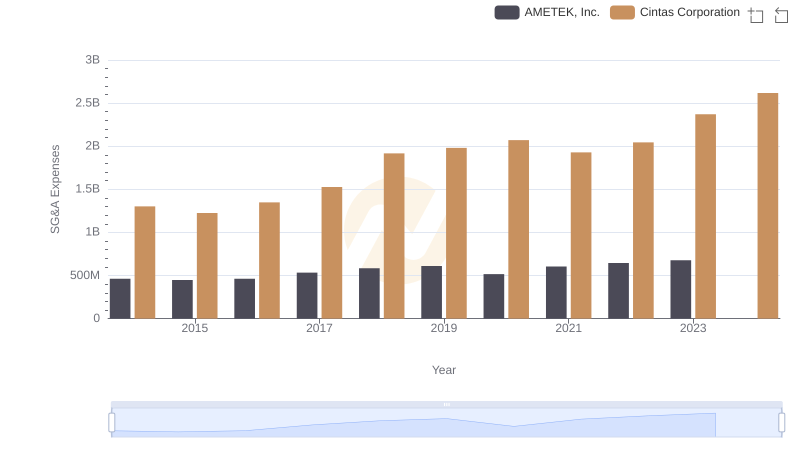
Cintas Corporation vs AMETEK, Inc.: SG&A Expense Trends
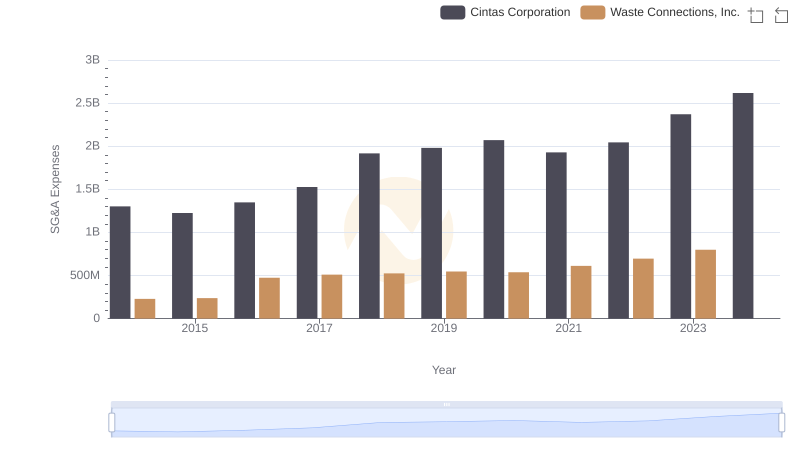
SG&A Efficiency Analysis: Comparing Cintas Corporation and Waste Connections, Inc.
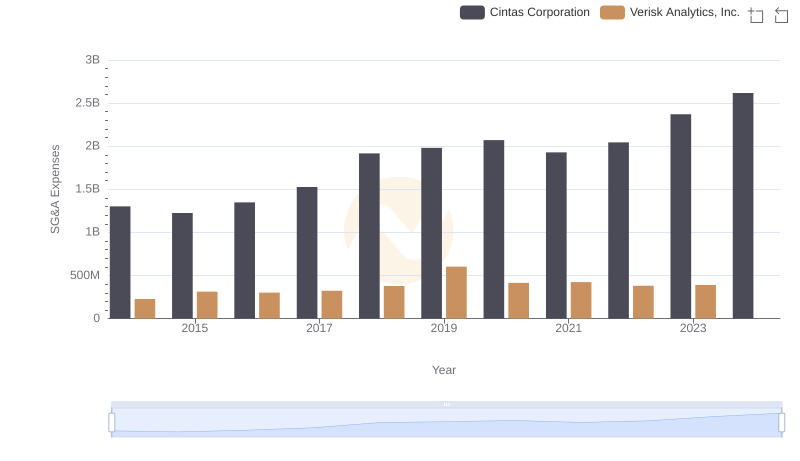
Cintas Corporation vs Verisk Analytics, Inc.: SG&A Expense Trends
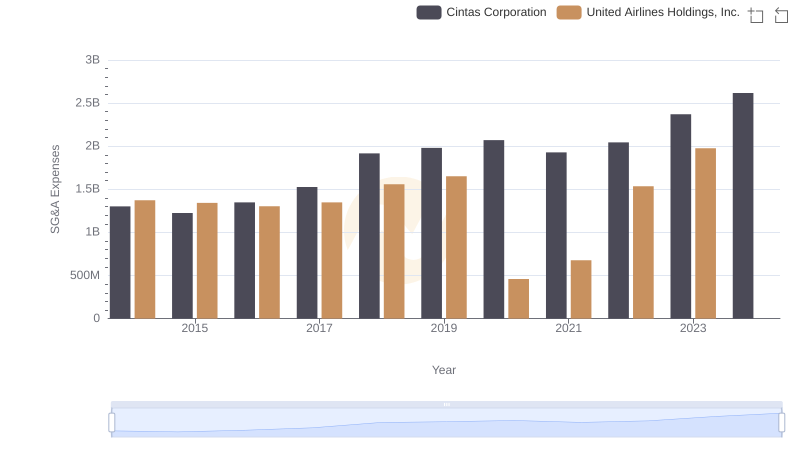
SG&A Efficiency Analysis: Comparing Cintas Corporation and United Airlines Holdings, Inc.
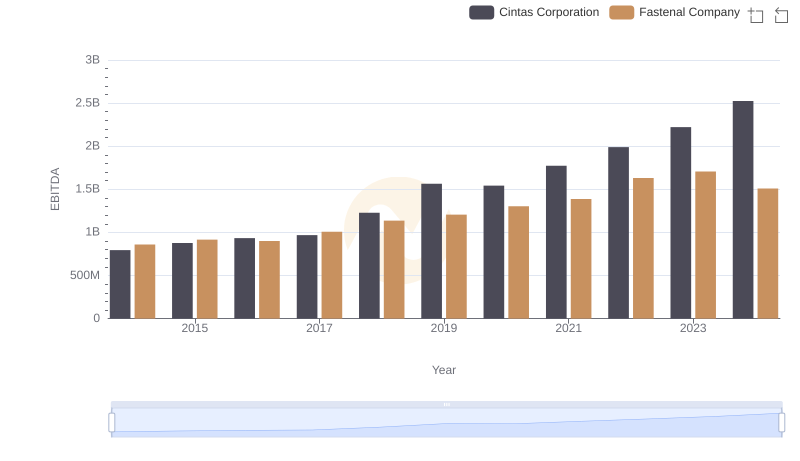
EBITDA Analysis: Evaluating Cintas Corporation Against Fastenal Company