| __timestamp | Cintas Corporation | Snap-on Incorporated |
|---|---|---|
| Wednesday, January 1, 2014 | 793811000 | 767600000 |
| Thursday, January 1, 2015 | 877761000 | 848900000 |
| Friday, January 1, 2016 | 933728000 | 942400000 |
| Sunday, January 1, 2017 | 968293000 | 971900000 |
| Monday, January 1, 2018 | 1227852000 | 1057400000 |
| Tuesday, January 1, 2019 | 1564228000 | 1067000000 |
| Wednesday, January 1, 2020 | 1542737000 | 991400000 |
| Friday, January 1, 2021 | 1773591000 | 1249100000 |
| Saturday, January 1, 2022 | 1990046000 | 1351500000 |
| Sunday, January 1, 2023 | 2221676000 | 1478800000 |
| Monday, January 1, 2024 | 2523857000 | 1520700000 |
Igniting the spark of knowledge
In the world of corporate finance, EBITDA serves as a crucial metric for evaluating a company's operational performance. Over the past decade, Cintas Corporation and Snap-on Incorporated have showcased intriguing trajectories in their EBITDA growth. From 2014 to 2023, Cintas Corporation's EBITDA surged by approximately 218%, reflecting its robust business strategies and market adaptability. In contrast, Snap-on Incorporated experienced a more modest growth of around 93% during the same period. Notably, Cintas consistently outperformed Snap-on, with its EBITDA peaking at 2.52 billion in 2024, while Snap-on's data for 2024 remains elusive. This comparison not only highlights the dynamic nature of these industry leaders but also underscores the importance of strategic planning in achieving financial success. As we look to the future, the absence of Snap-on's 2024 data leaves room for speculation and anticipation.
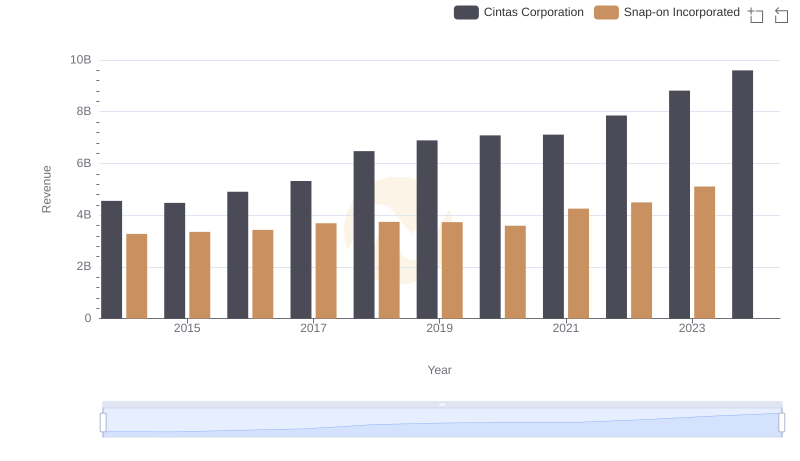
Comparing Revenue Performance: Cintas Corporation or Snap-on Incorporated?
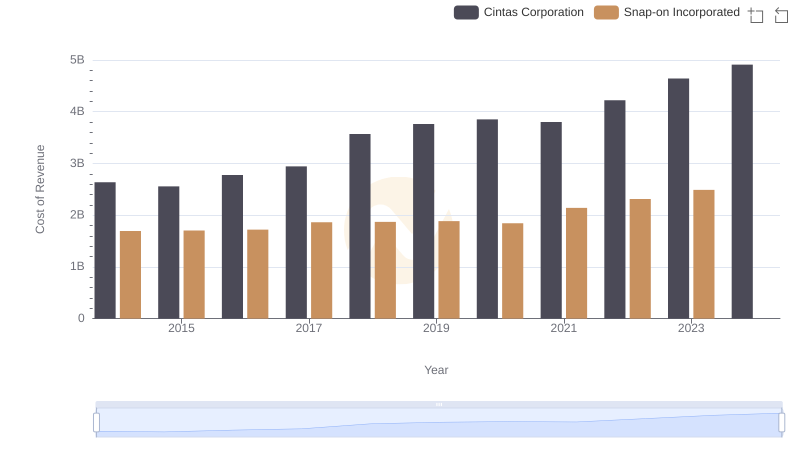
Analyzing Cost of Revenue: Cintas Corporation and Snap-on Incorporated
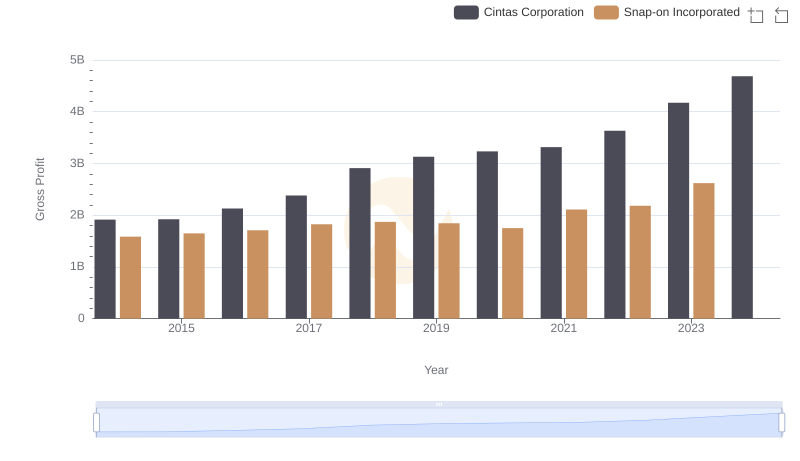
Gross Profit Trends Compared: Cintas Corporation vs Snap-on Incorporated
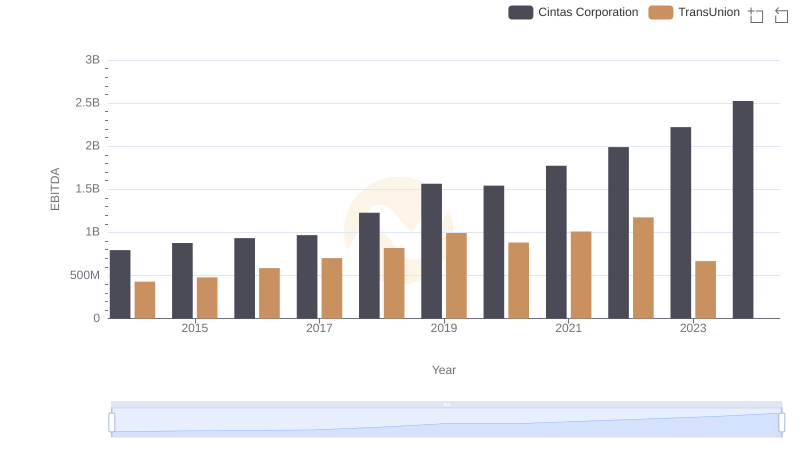
EBITDA Performance Review: Cintas Corporation vs TransUnion
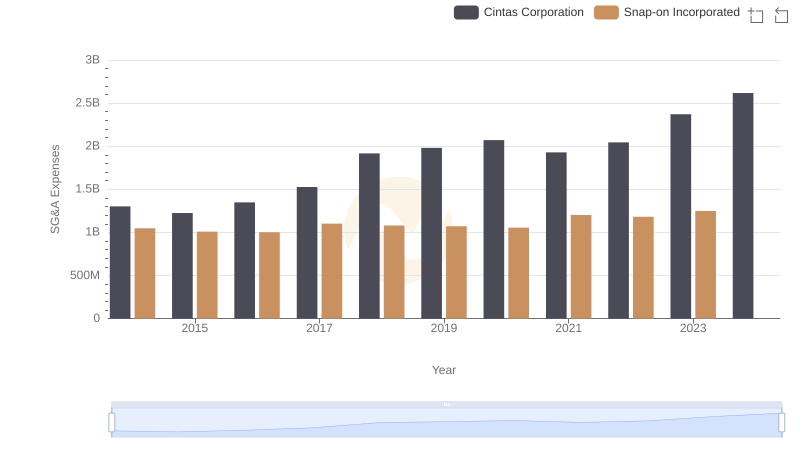
Selling, General, and Administrative Costs: Cintas Corporation vs Snap-on Incorporated
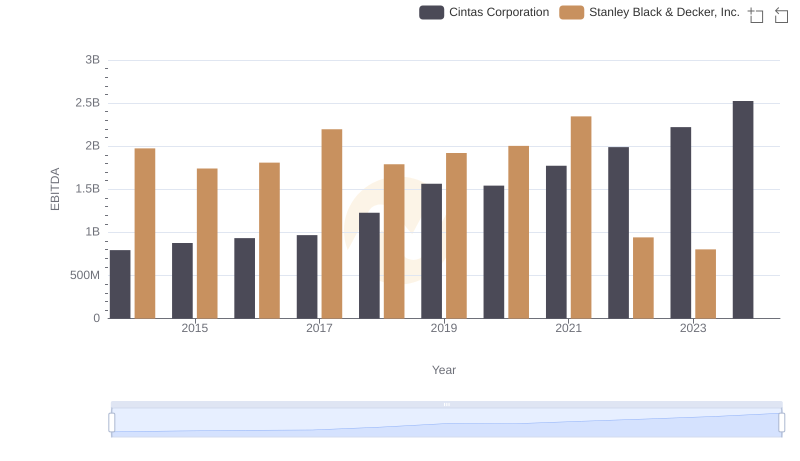
Cintas Corporation vs Stanley Black & Decker, Inc.: In-Depth EBITDA Performance Comparison
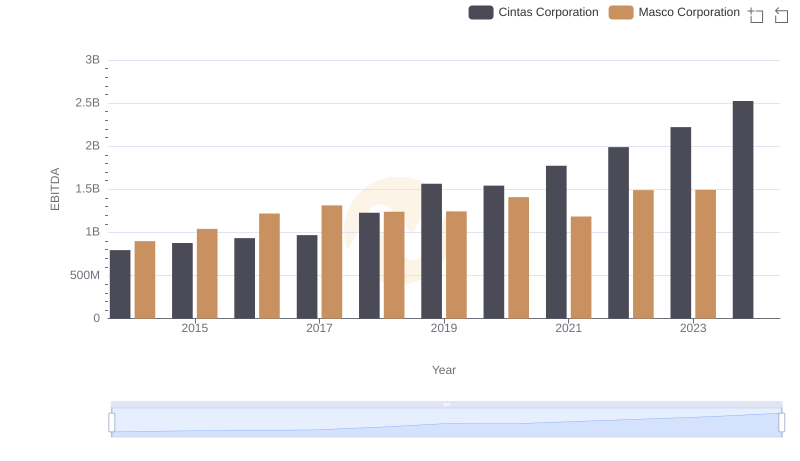
Cintas Corporation and Masco Corporation: A Detailed Examination of EBITDA Performance
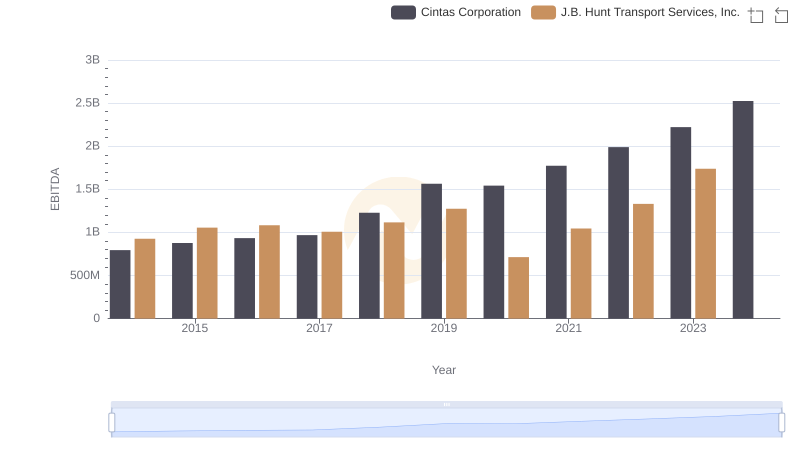
Comparative EBITDA Analysis: Cintas Corporation vs J.B. Hunt Transport Services, Inc.
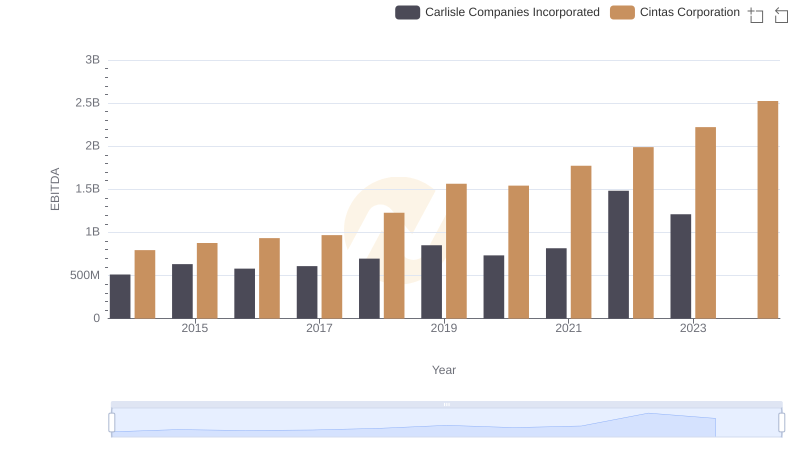
EBITDA Metrics Evaluated: Cintas Corporation vs Carlisle Companies Incorporated
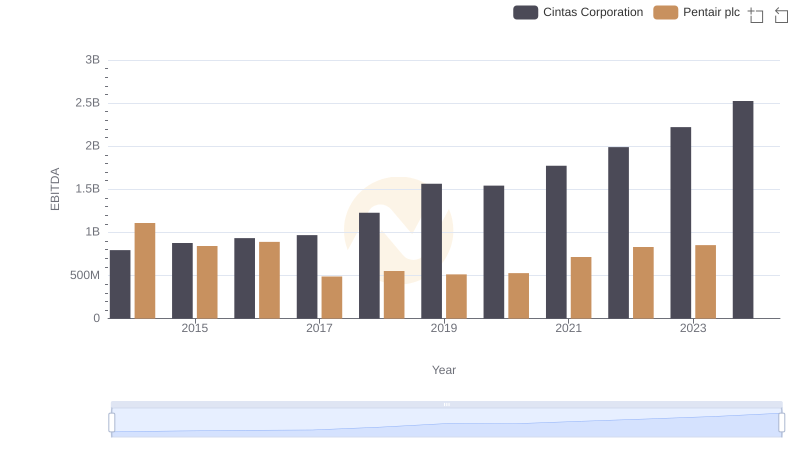
Professional EBITDA Benchmarking: Cintas Corporation vs Pentair plc
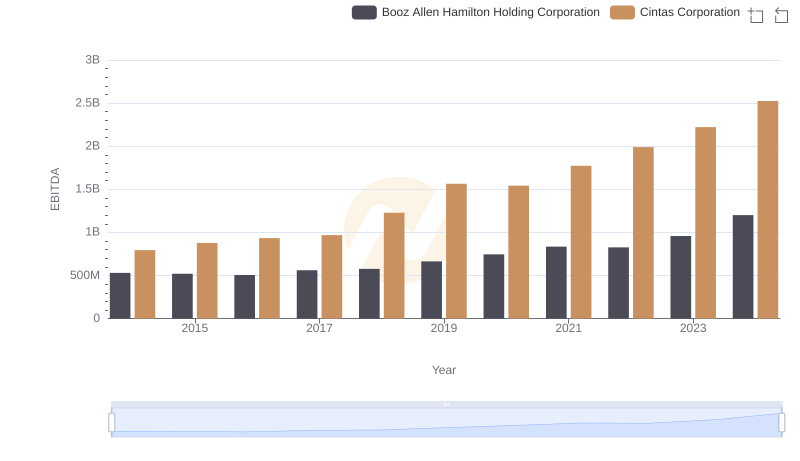
Cintas Corporation and Booz Allen Hamilton Holding Corporation: A Detailed Examination of EBITDA Performance