| __timestamp | Cintas Corporation | Snap-on Incorporated |
|---|---|---|
| Wednesday, January 1, 2014 | 2637426000 | 1693400000 |
| Thursday, January 1, 2015 | 2555549000 | 1704500000 |
| Friday, January 1, 2016 | 2775588000 | 1720800000 |
| Sunday, January 1, 2017 | 2943086000 | 1862000000 |
| Monday, January 1, 2018 | 3568109000 | 1870700000 |
| Tuesday, January 1, 2019 | 3763715000 | 1886000000 |
| Wednesday, January 1, 2020 | 3851372000 | 1844000000 |
| Friday, January 1, 2021 | 3801689000 | 2141200000 |
| Saturday, January 1, 2022 | 4222213000 | 2311700000 |
| Sunday, January 1, 2023 | 4642401000 | 2488500000 |
| Monday, January 1, 2024 | 4910199000 | 2329500000 |
Cracking the code
In the ever-evolving landscape of American industry, Cintas Corporation and Snap-on Incorporated stand as titans in their respective fields. From 2014 to 2023, Cintas has seen a remarkable 86% increase in its cost of revenue, reflecting its aggressive expansion and operational scaling. In contrast, Snap-on's cost of revenue has grown by 47% over the same period, showcasing its steady yet robust growth strategy.
Cintas, a leader in corporate identity uniform programs, has consistently increased its cost of revenue, peaking at nearly $4.9 billion in 2023. This growth underscores its strategic investments and market penetration.
Snap-on, renowned for its high-quality tools, has also shown a significant upward trend, with its cost of revenue reaching approximately $2.5 billion in 2023. This reflects its commitment to innovation and customer satisfaction.
The data for 2024 remains incomplete, hinting at future developments that could further shape these industry leaders.
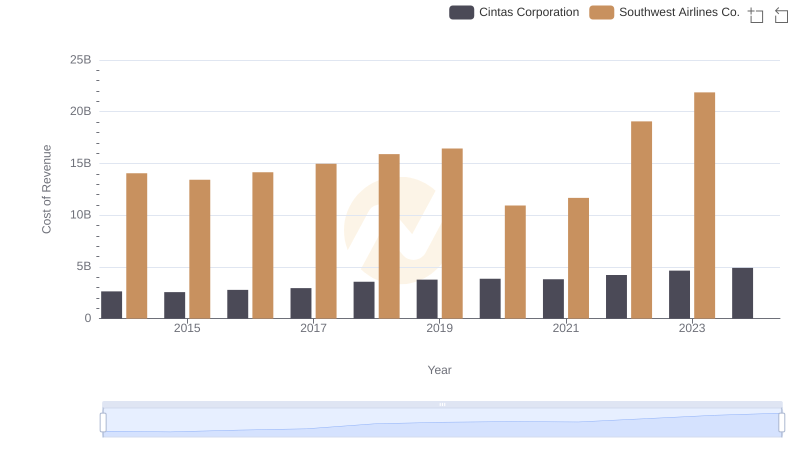
Comparing Cost of Revenue Efficiency: Cintas Corporation vs Southwest Airlines Co.
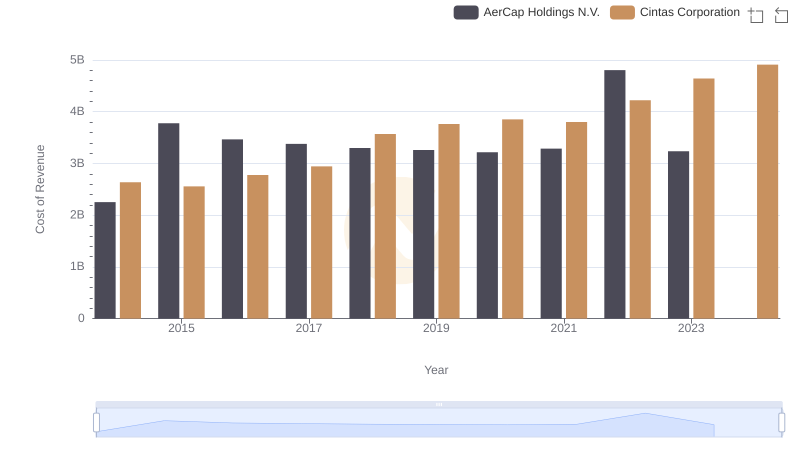
Cost of Revenue Trends: Cintas Corporation vs AerCap Holdings N.V.
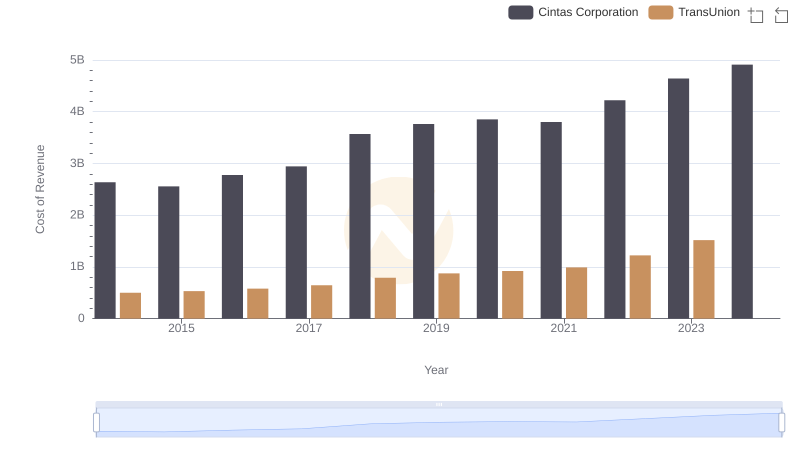
Cost of Revenue Trends: Cintas Corporation vs TransUnion
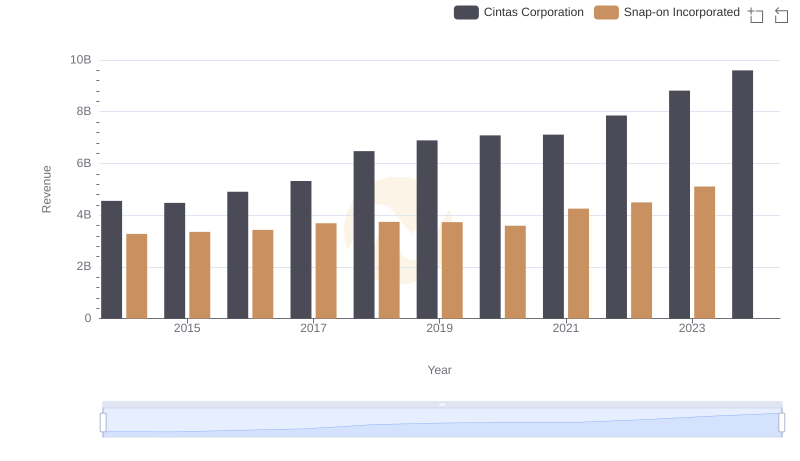
Comparing Revenue Performance: Cintas Corporation or Snap-on Incorporated?
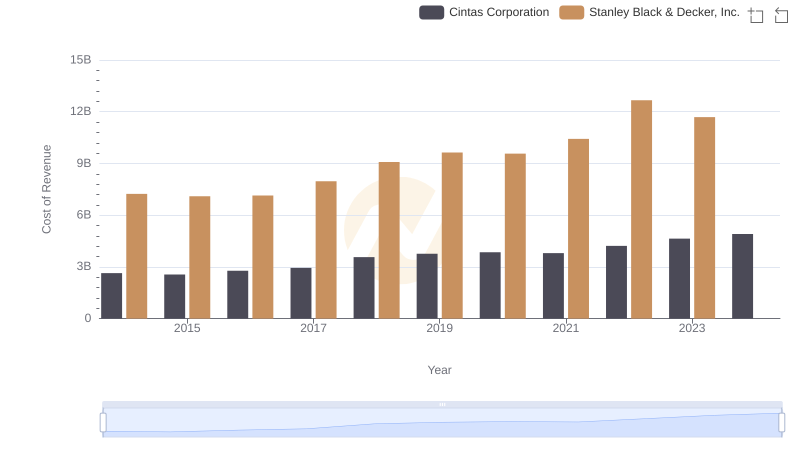
Cost of Revenue: Key Insights for Cintas Corporation and Stanley Black & Decker, Inc.
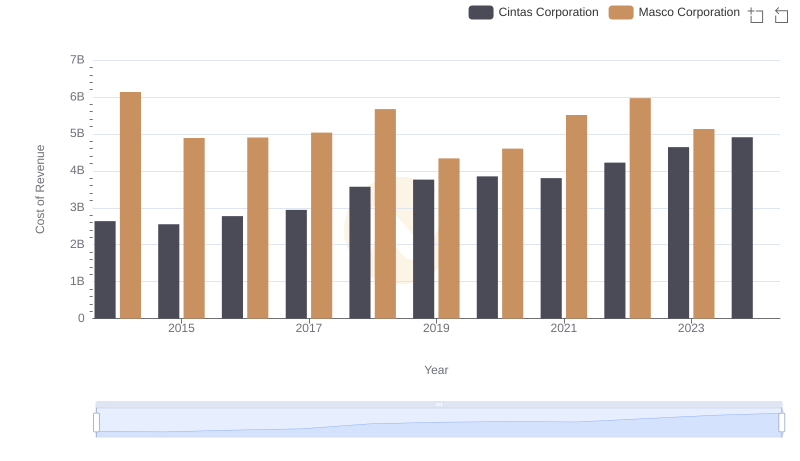
Comparing Cost of Revenue Efficiency: Cintas Corporation vs Masco Corporation
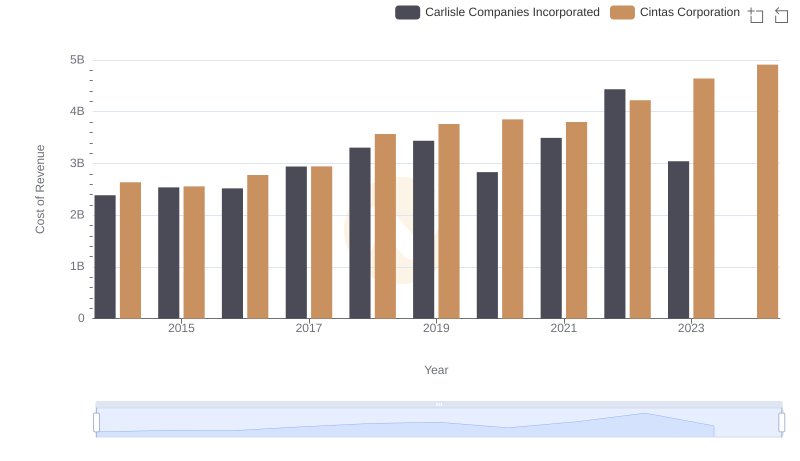
Cost of Revenue: Key Insights for Cintas Corporation and Carlisle Companies Incorporated
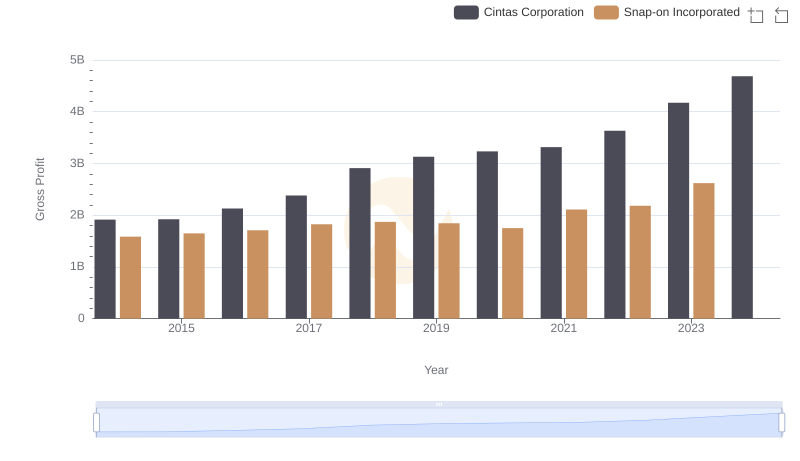
Gross Profit Trends Compared: Cintas Corporation vs Snap-on Incorporated
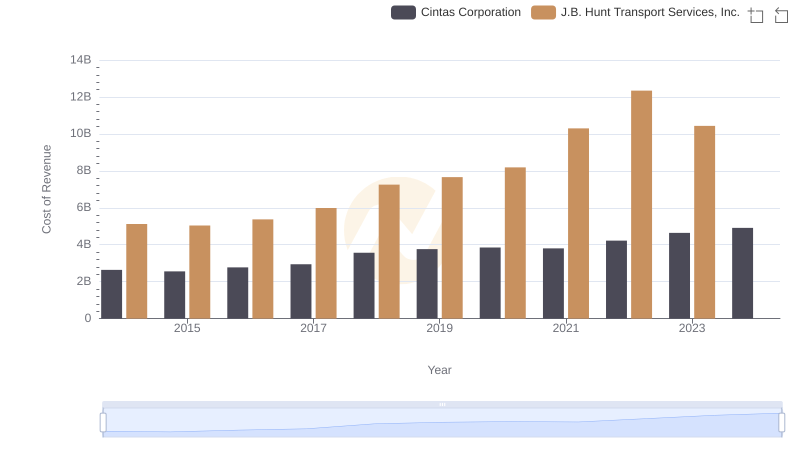
Cintas Corporation vs J.B. Hunt Transport Services, Inc.: Efficiency in Cost of Revenue Explored
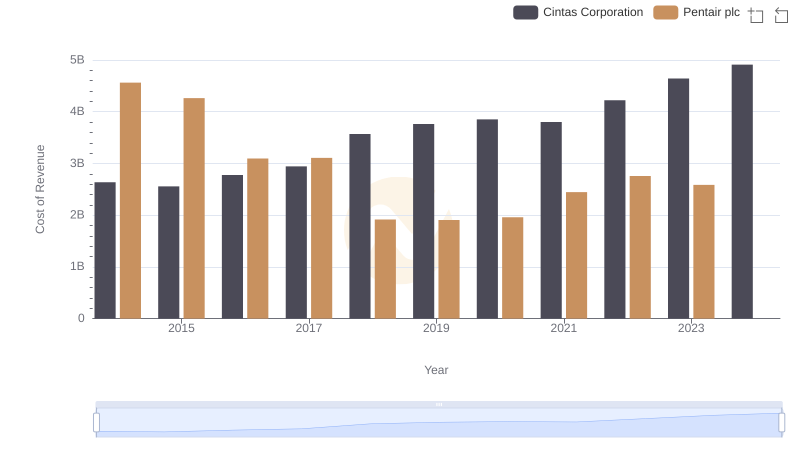
Cost of Revenue Comparison: Cintas Corporation vs Pentair plc
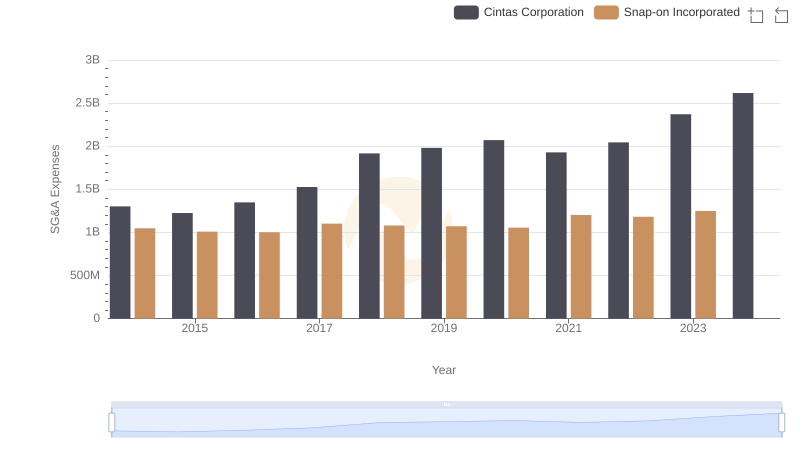
Selling, General, and Administrative Costs: Cintas Corporation vs Snap-on Incorporated
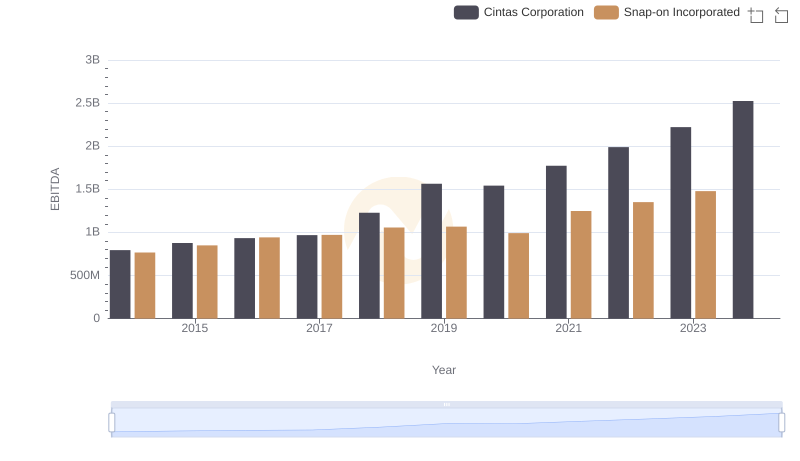
EBITDA Metrics Evaluated: Cintas Corporation vs Snap-on Incorporated