| __timestamp | Intuit Inc. | NXP Semiconductors N.V. |
|---|---|---|
| Wednesday, January 1, 2014 | 3838000000 | 2640000000 |
| Thursday, January 1, 2015 | 3467000000 | 2787000000 |
| Friday, January 1, 2016 | 3942000000 | 4069000000 |
| Sunday, January 1, 2017 | 4368000000 | 4619000000 |
| Monday, January 1, 2018 | 4987000000 | 4851000000 |
| Tuesday, January 1, 2019 | 5617000000 | 4618000000 |
| Wednesday, January 1, 2020 | 6301000000 | 4235000000 |
| Friday, January 1, 2021 | 7950000000 | 6067000000 |
| Saturday, January 1, 2022 | 10320000000 | 7517000000 |
| Sunday, January 1, 2023 | 11225000000 | 7553000000 |
| Monday, January 1, 2024 | 12820000000 |
Unlocking the unknown
In the ever-evolving landscape of technology and finance, Intuit Inc. and NXP Semiconductors N.V. have emerged as formidable players. Over the past decade, Intuit has demonstrated a remarkable growth trajectory, with its gross profit surging by approximately 234% from 2014 to 2023. This growth underscores Intuit's strategic prowess in the financial software sector, capitalizing on the increasing demand for digital solutions.
Conversely, NXP Semiconductors, a leader in the semiconductor industry, has shown a steady increase in gross profit, with a notable 186% rise from 2014 to 2022. However, data for 2024 remains elusive, leaving room for speculation on its future performance.
As we delve into these trends, it's evident that both companies are navigating their respective industries with agility and foresight, setting benchmarks for innovation and profitability.
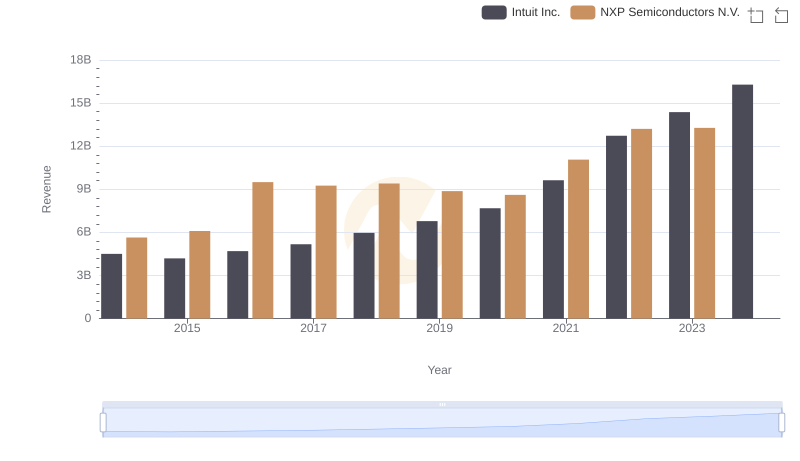
Intuit Inc. and NXP Semiconductors N.V.: A Comprehensive Revenue Analysis
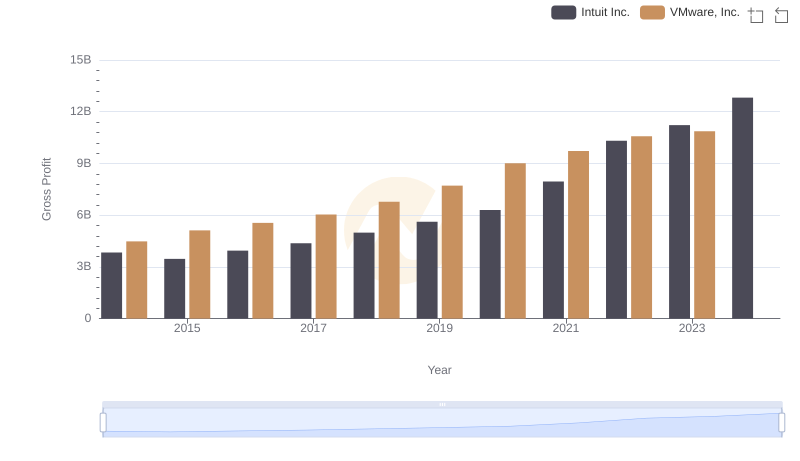
Intuit Inc. and VMware, Inc.: A Detailed Gross Profit Analysis
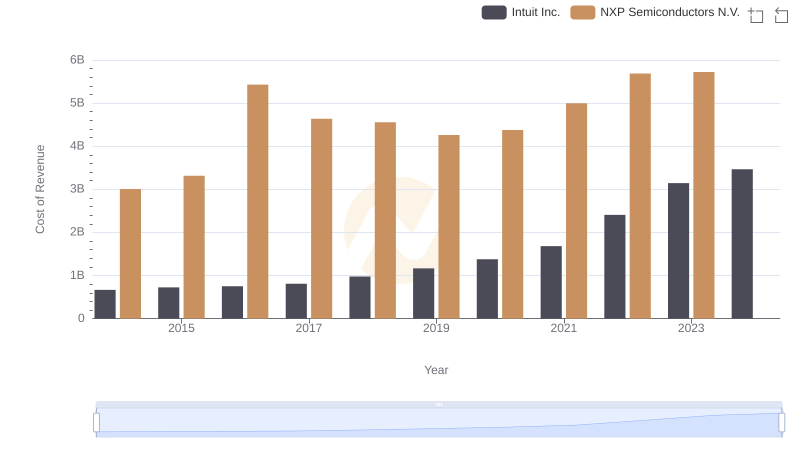
Comparing Cost of Revenue Efficiency: Intuit Inc. vs NXP Semiconductors N.V.
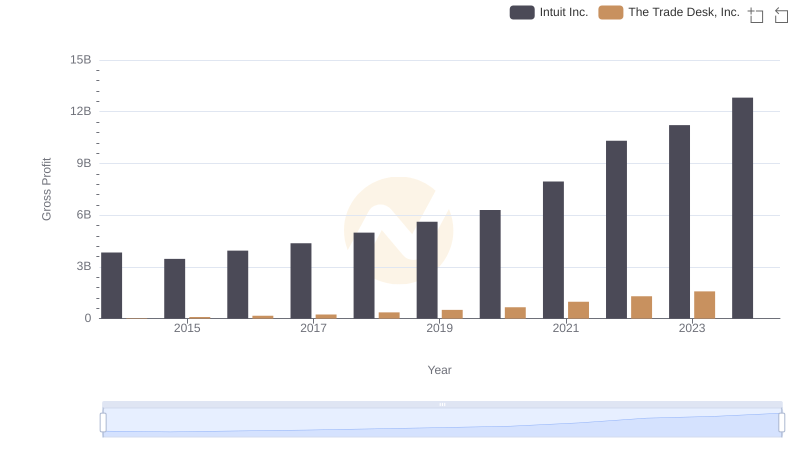
Gross Profit Comparison: Intuit Inc. and The Trade Desk, Inc. Trends
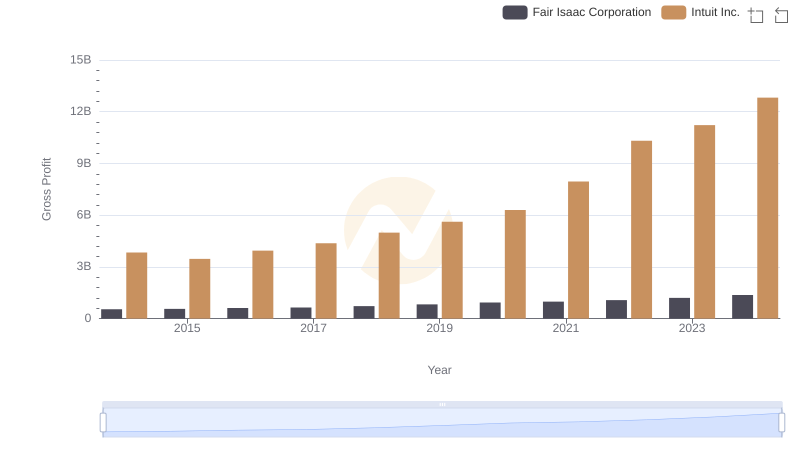
Intuit Inc. and Fair Isaac Corporation: A Detailed Gross Profit Analysis
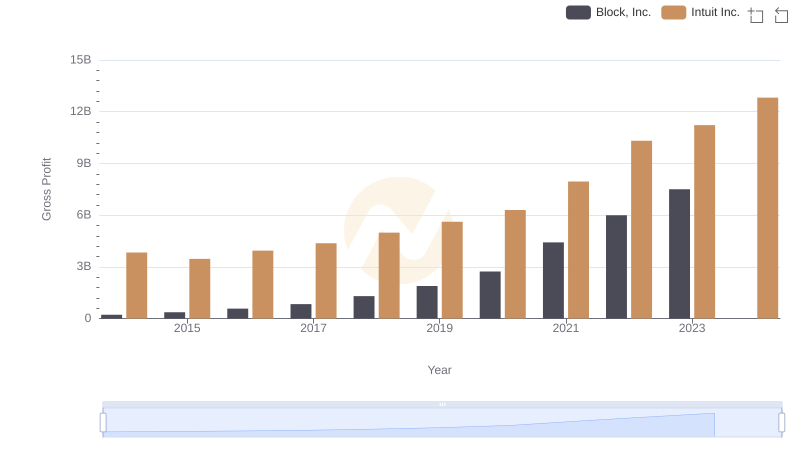
Gross Profit Comparison: Intuit Inc. and Block, Inc. Trends
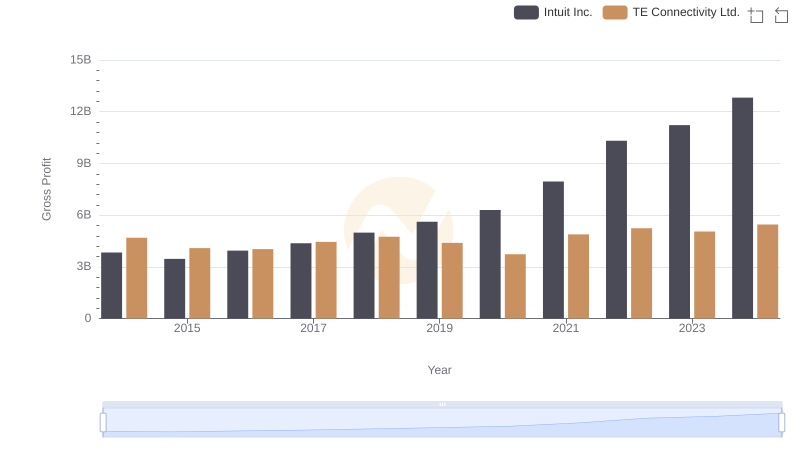
Intuit Inc. vs TE Connectivity Ltd.: A Gross Profit Performance Breakdown
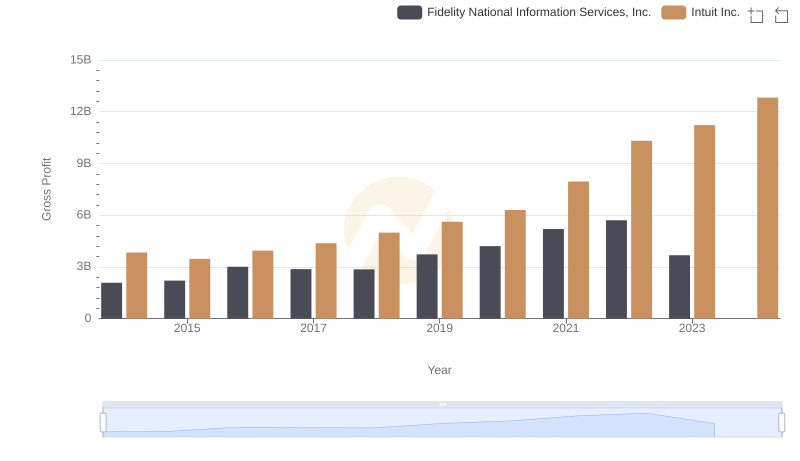
Gross Profit Analysis: Comparing Intuit Inc. and Fidelity National Information Services, Inc.
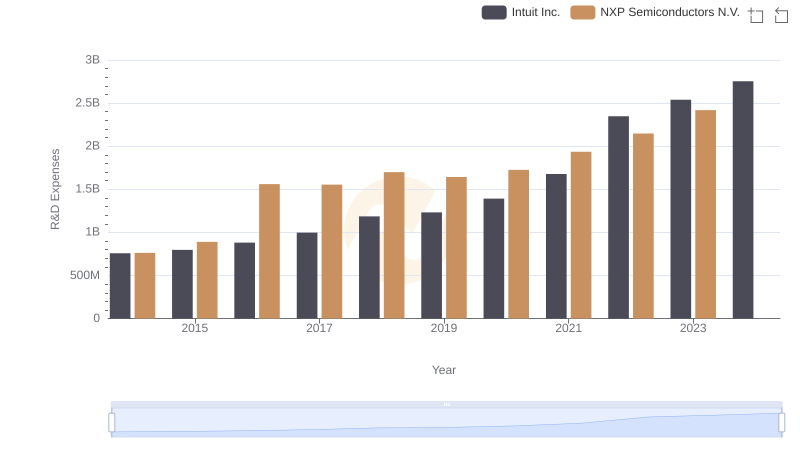
Who Prioritizes Innovation? R&D Spending Compared for Intuit Inc. and NXP Semiconductors N.V.
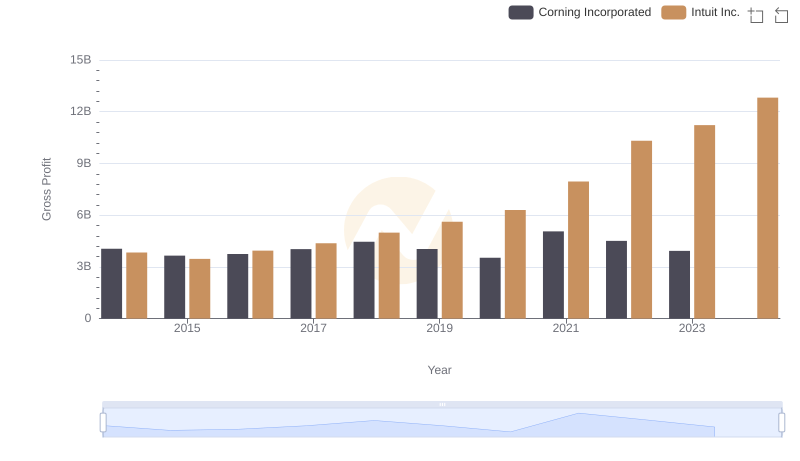
Gross Profit Trends Compared: Intuit Inc. vs Corning Incorporated
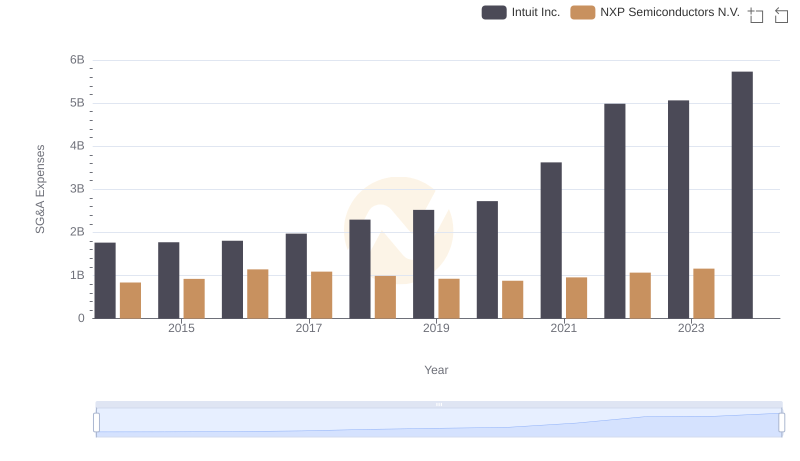
Cost Management Insights: SG&A Expenses for Intuit Inc. and NXP Semiconductors N.V.
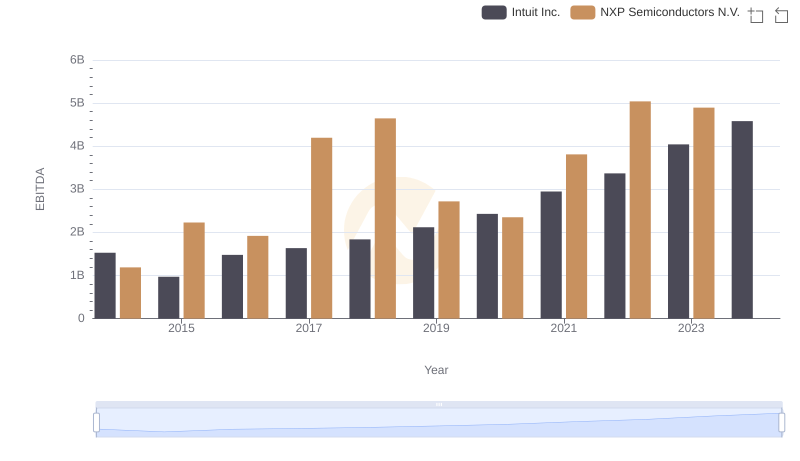
Professional EBITDA Benchmarking: Intuit Inc. vs NXP Semiconductors N.V.