| __timestamp | Intuit Inc. | NXP Semiconductors N.V. |
|---|---|---|
| Wednesday, January 1, 2014 | 4506000000 | 5647000000 |
| Thursday, January 1, 2015 | 4192000000 | 6101000000 |
| Friday, January 1, 2016 | 4694000000 | 9498000000 |
| Sunday, January 1, 2017 | 5177000000 | 9256000000 |
| Monday, January 1, 2018 | 5964000000 | 9407000000 |
| Tuesday, January 1, 2019 | 6784000000 | 8877000000 |
| Wednesday, January 1, 2020 | 7679000000 | 8612000000 |
| Friday, January 1, 2021 | 9633000000 | 11063000000 |
| Saturday, January 1, 2022 | 12726000000 | 13205000000 |
| Sunday, January 1, 2023 | 14368000000 | 13276000000 |
| Monday, January 1, 2024 | 16285000000 |
Data in motion
In the ever-evolving landscape of technology, Intuit Inc. and NXP Semiconductors N.V. have emerged as formidable players. Over the past decade, Intuit's revenue has surged by approximately 261%, starting from 2014 with a modest $4.5 billion and reaching an impressive $16.3 billion by 2024. This growth reflects Intuit's strategic expansion and innovation in financial software solutions.
Meanwhile, NXP Semiconductors has demonstrated a robust revenue trajectory, growing by about 135% from 2014 to 2023. Despite a slight dip in 2019, NXP's revenue rebounded, peaking at $13.3 billion in 2023. This growth underscores NXP's pivotal role in the semiconductor industry, particularly in automotive and IoT sectors.
While Intuit's 2024 data is available, NXP's is not, leaving room for speculation on its future performance. This analysis highlights the dynamic nature of tech revenues and the potential for continued growth.
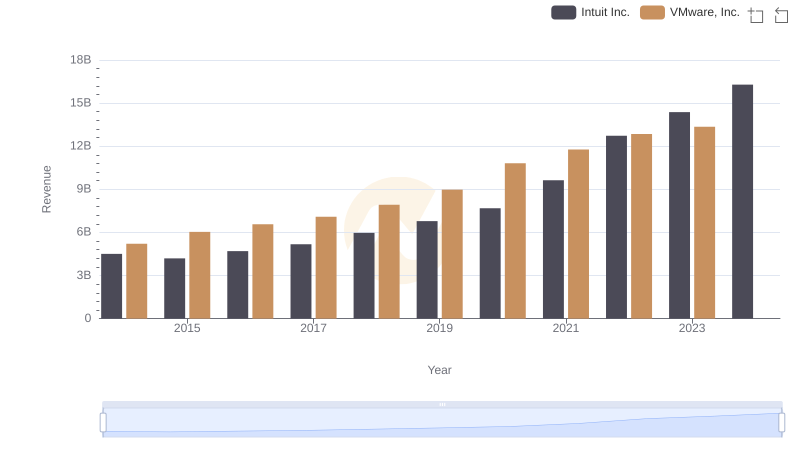
Intuit Inc. vs VMware, Inc.: Examining Key Revenue Metrics
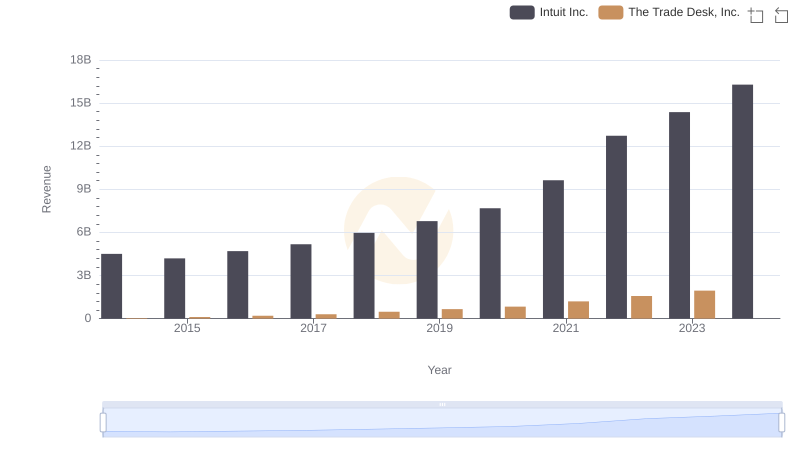
Revenue Insights: Intuit Inc. and The Trade Desk, Inc. Performance Compared
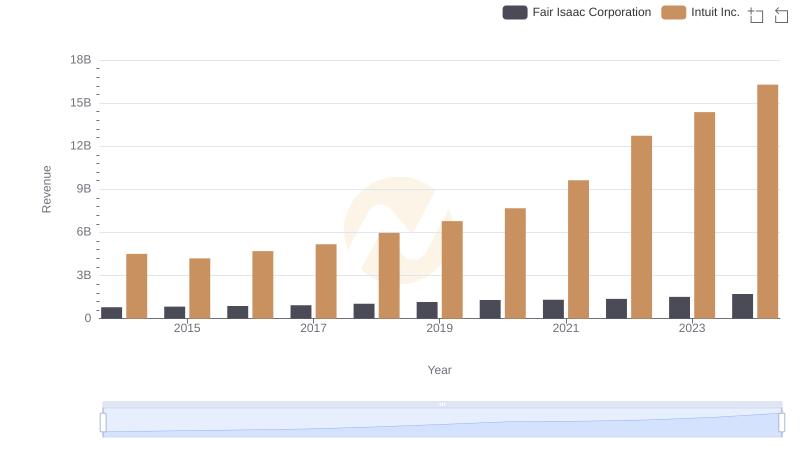
Revenue Insights: Intuit Inc. and Fair Isaac Corporation Performance Compared
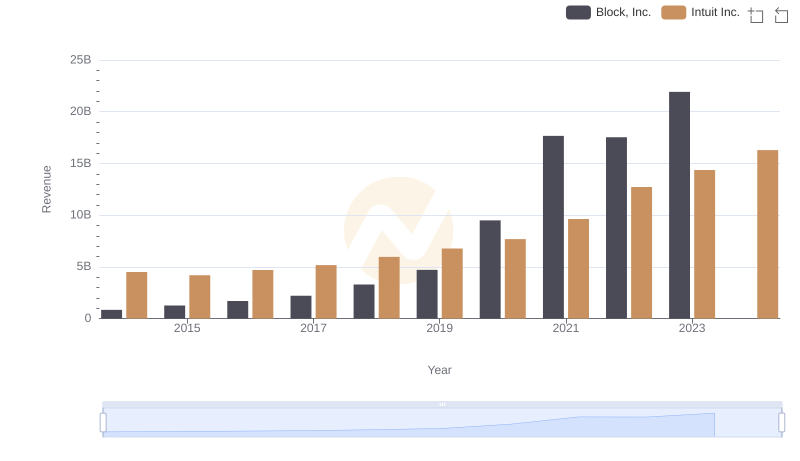
Breaking Down Revenue Trends: Intuit Inc. vs Block, Inc.
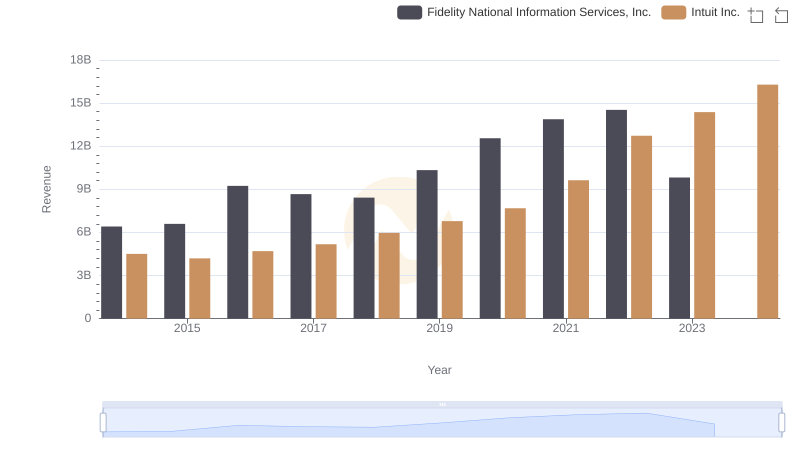
Revenue Insights: Intuit Inc. and Fidelity National Information Services, Inc. Performance Compared
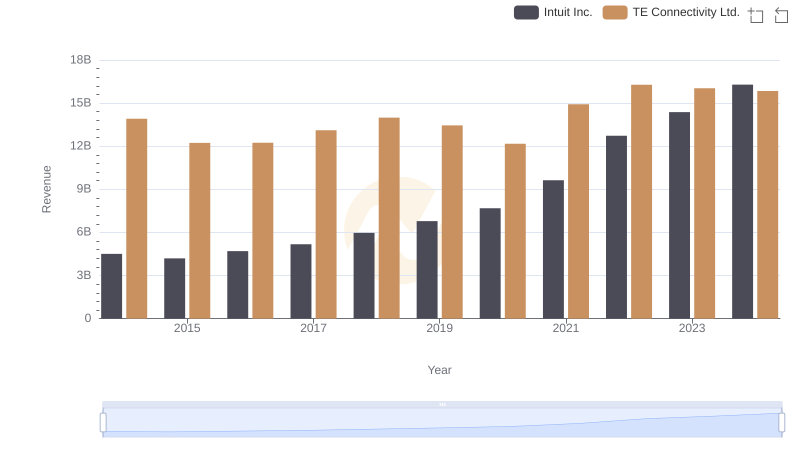
Annual Revenue Comparison: Intuit Inc. vs TE Connectivity Ltd.
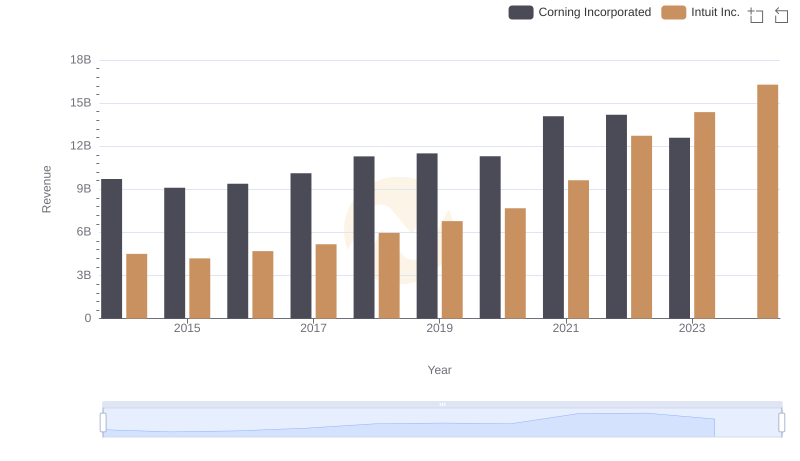
Intuit Inc. vs Corning Incorporated: Examining Key Revenue Metrics
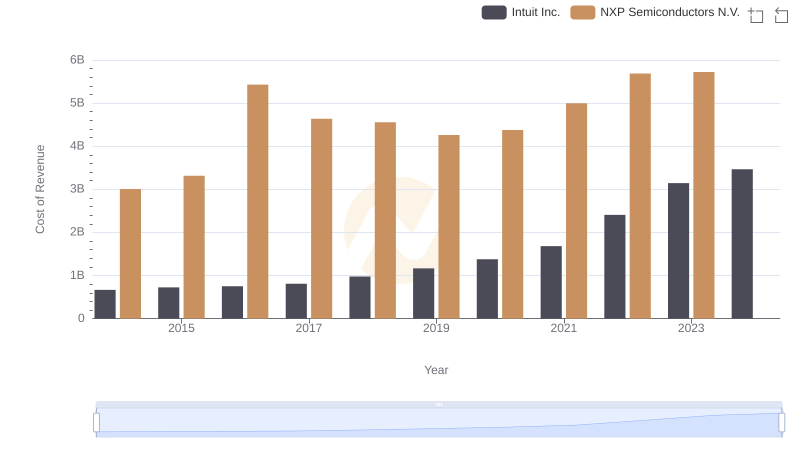
Comparing Cost of Revenue Efficiency: Intuit Inc. vs NXP Semiconductors N.V.
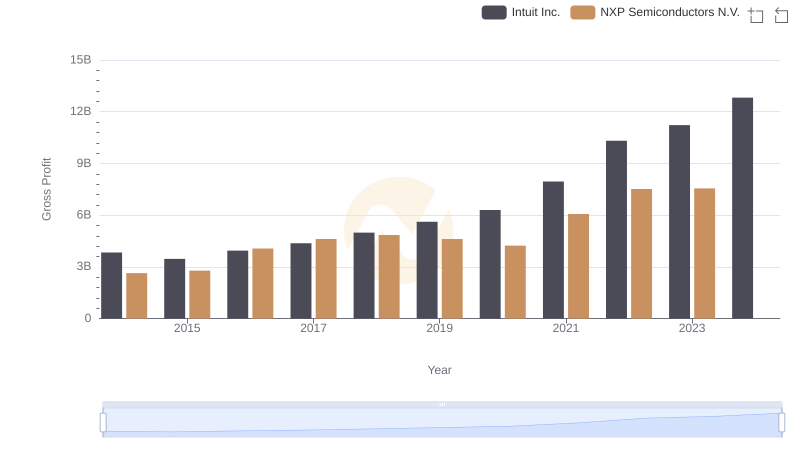
Gross Profit Trends Compared: Intuit Inc. vs NXP Semiconductors N.V.
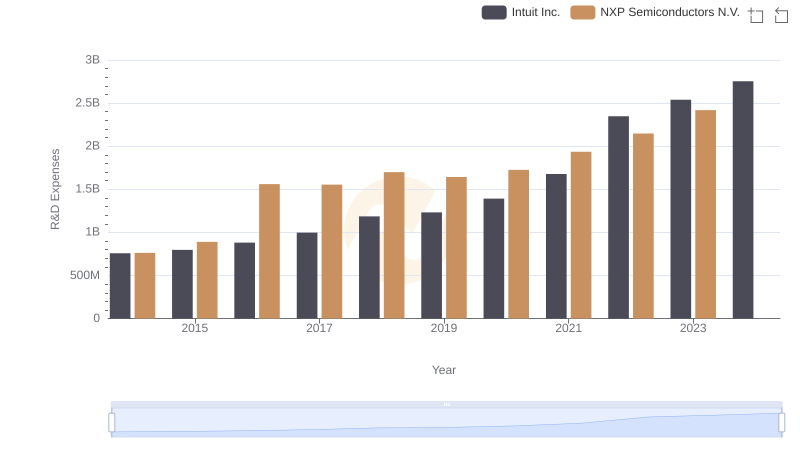
Who Prioritizes Innovation? R&D Spending Compared for Intuit Inc. and NXP Semiconductors N.V.
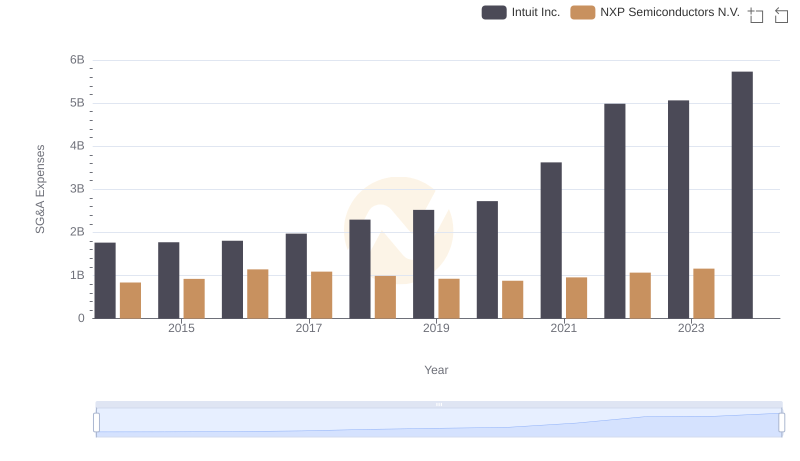
Cost Management Insights: SG&A Expenses for Intuit Inc. and NXP Semiconductors N.V.
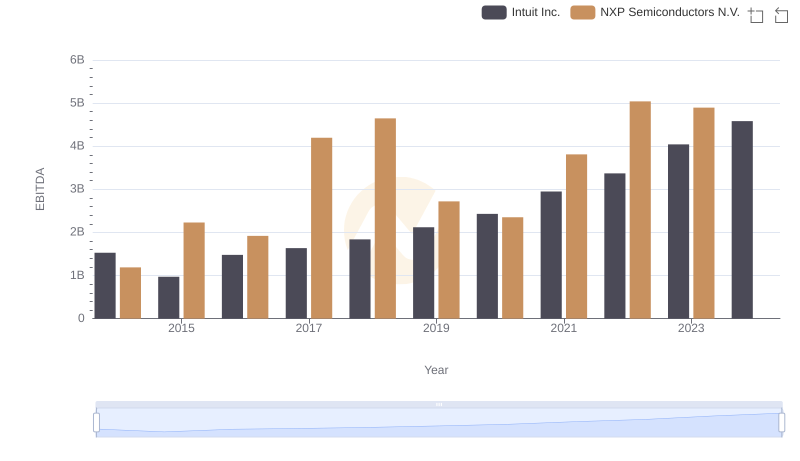
Professional EBITDA Benchmarking: Intuit Inc. vs NXP Semiconductors N.V.