| __timestamp | Fortive Corporation | International Business Machines Corporation |
|---|---|---|
| Wednesday, January 1, 2014 | 3288000000 | 46386000000 |
| Thursday, January 1, 2015 | 3183500000 | 41057000000 |
| Friday, January 1, 2016 | 3191500000 | 41403000000 |
| Sunday, January 1, 2017 | 3357500000 | 42196000000 |
| Monday, January 1, 2018 | 3131400000 | 42655000000 |
| Tuesday, January 1, 2019 | 3639700000 | 26181000000 |
| Wednesday, January 1, 2020 | 2025900000 | 24314000000 |
| Friday, January 1, 2021 | 2247600000 | 25865000000 |
| Saturday, January 1, 2022 | 2462300000 | 27842000000 |
| Sunday, January 1, 2023 | 2471200000 | 27560000000 |
| Monday, January 1, 2024 | 2500800000 | 27202000000 |
Cracking the code
In the ever-evolving landscape of technology and industrial solutions, the cost of revenue is a critical metric that reflects a company's efficiency and market strategy. Over the past decade, International Business Machines Corporation (IBM) and Fortive Corporation have showcased contrasting trends in their cost of revenue.
From 2014 to 2023, IBM's cost of revenue has seen a significant decline of approximately 41%, dropping from around $46 billion to $27.6 billion. This reduction highlights IBM's strategic shift towards more efficient operations and possibly a focus on higher-margin services. In contrast, Fortive's cost of revenue has experienced a more modest decrease of about 25%, from $3.3 billion to $2.5 billion, indicating a steady approach in managing production costs while expanding its industrial technology portfolio.
These trends underscore the distinct paths these corporations have taken in response to market demands and technological advancements.
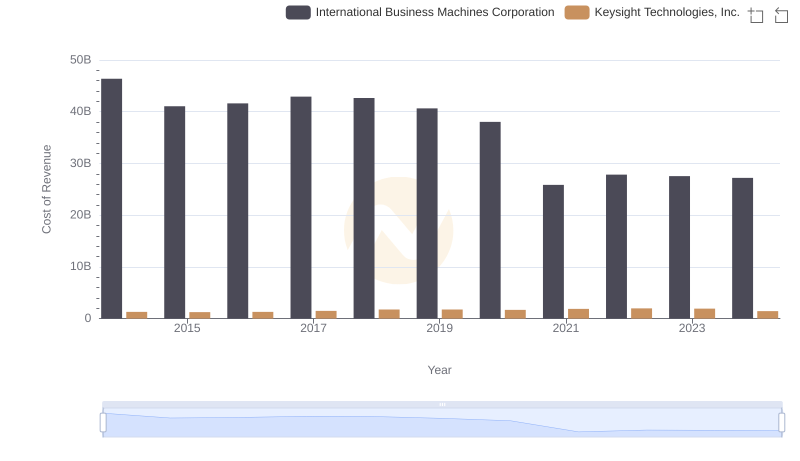
Cost of Revenue Trends: International Business Machines Corporation vs Keysight Technologies, Inc.
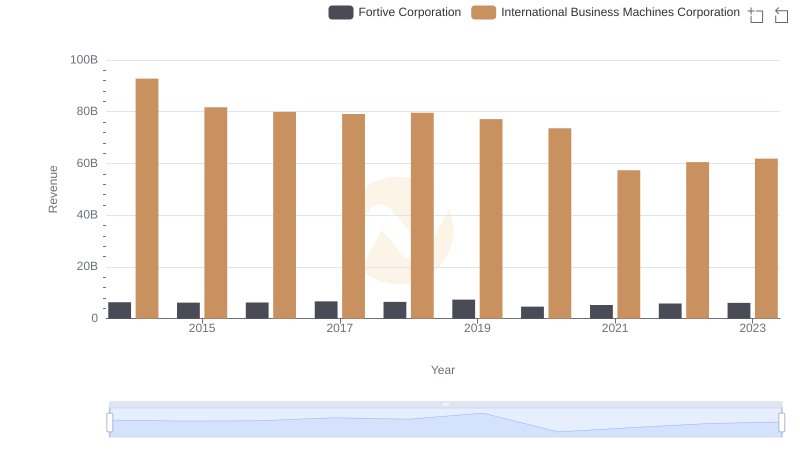
Annual Revenue Comparison: International Business Machines Corporation vs Fortive Corporation

Analyzing Cost of Revenue: International Business Machines Corporation and Broadridge Financial Solutions, Inc.
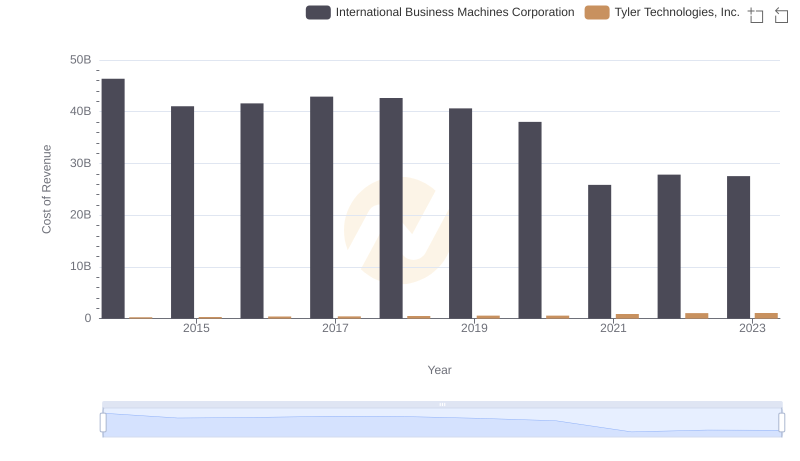
Cost of Revenue: Key Insights for International Business Machines Corporation and Tyler Technologies, Inc.
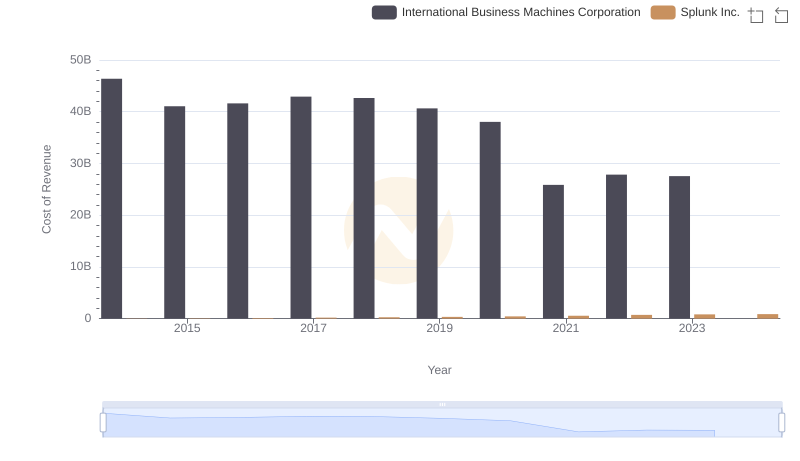
Cost of Revenue Comparison: International Business Machines Corporation vs Splunk Inc.
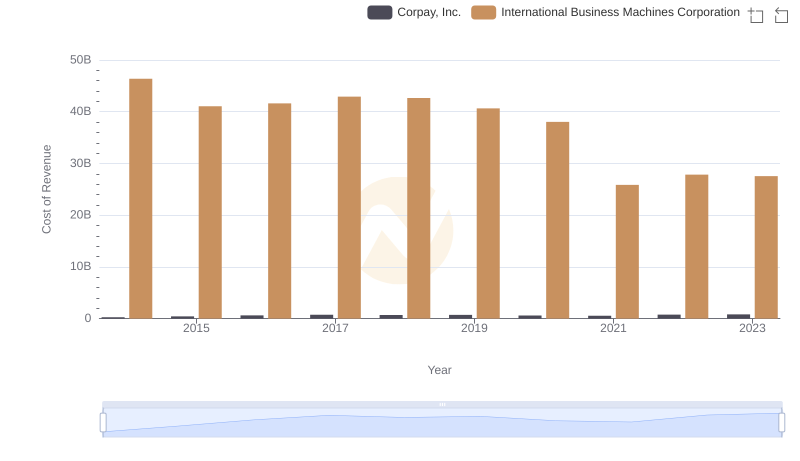
Analyzing Cost of Revenue: International Business Machines Corporation and Corpay, Inc.
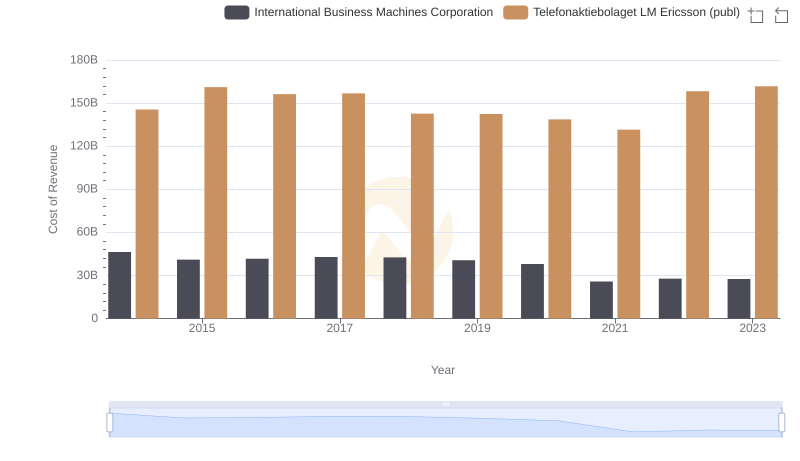
Cost of Revenue Trends: International Business Machines Corporation vs Telefonaktiebolaget LM Ericsson (publ)
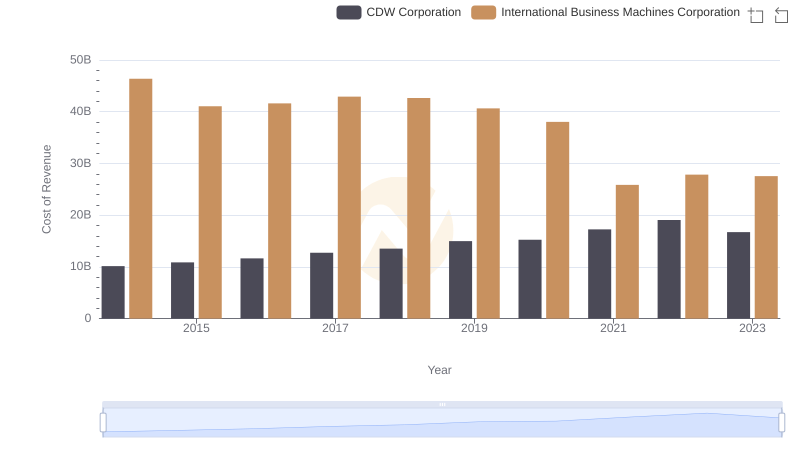
Analyzing Cost of Revenue: International Business Machines Corporation and CDW Corporation
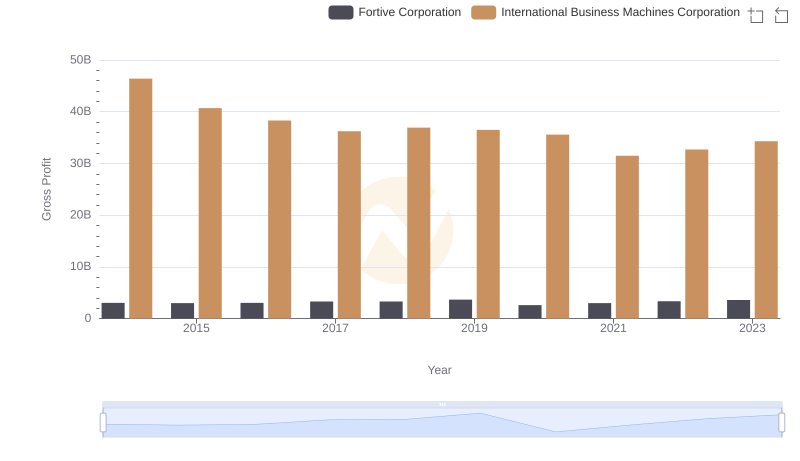
International Business Machines Corporation and Fortive Corporation: A Detailed Gross Profit Analysis
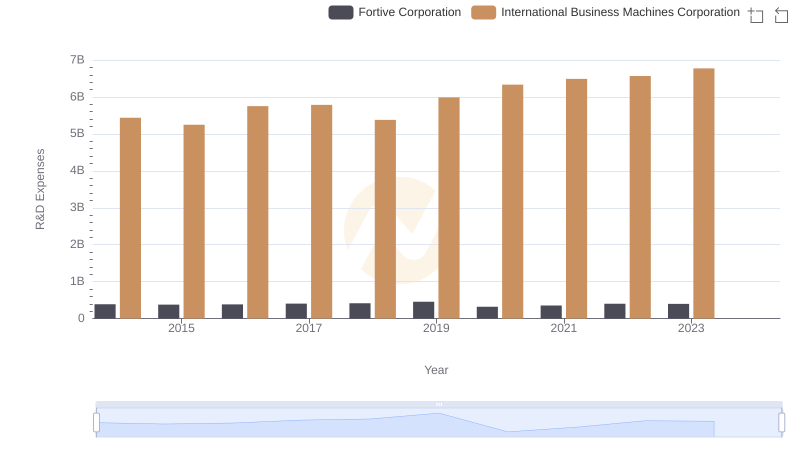
International Business Machines Corporation or Fortive Corporation: Who Invests More in Innovation?
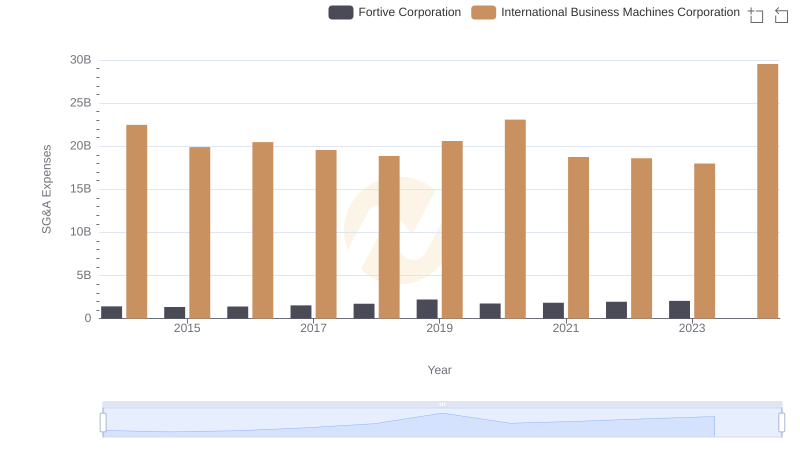
Who Optimizes SG&A Costs Better? International Business Machines Corporation or Fortive Corporation
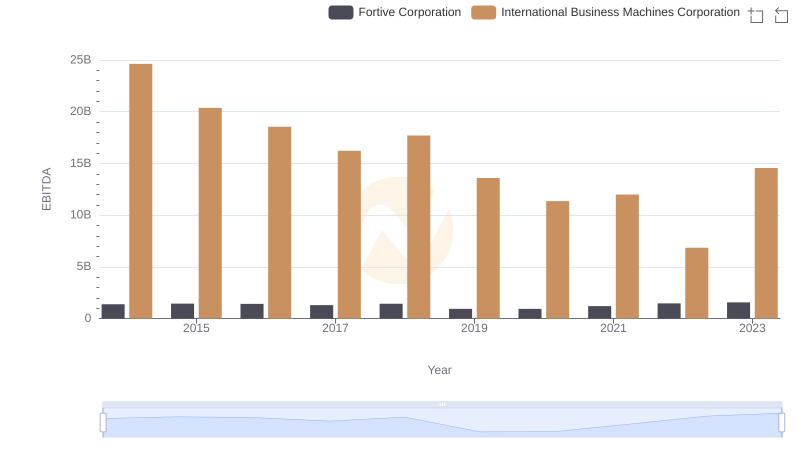
Professional EBITDA Benchmarking: International Business Machines Corporation vs Fortive Corporation