| __timestamp | Fortive Corporation | International Business Machines Corporation |
|---|---|---|
| Wednesday, January 1, 2014 | 3049200000 | 46407000000 |
| Thursday, January 1, 2015 | 2995300000 | 40684000000 |
| Friday, January 1, 2016 | 3032800000 | 38516000000 |
| Sunday, January 1, 2017 | 3298500000 | 36943000000 |
| Monday, January 1, 2018 | 3321300000 | 36936000000 |
| Tuesday, January 1, 2019 | 3680300000 | 31533000000 |
| Wednesday, January 1, 2020 | 2608500000 | 30865000000 |
| Friday, January 1, 2021 | 3007100000 | 31486000000 |
| Saturday, January 1, 2022 | 3363400000 | 32687000000 |
| Sunday, January 1, 2023 | 3594100000 | 34300000000 |
| Monday, January 1, 2024 | 3731000000 | 35551000000 |
Data in motion
In the ever-evolving landscape of technology and industrial solutions, International Business Machines Corporation (IBM) and Fortive Corporation stand as titans. From 2014 to 2023, IBM's gross profit has seen a notable decline of approximately 26%, from a peak of $46 billion in 2014 to $34 billion in 2023. This trend reflects the challenges faced by legacy tech companies in adapting to new market dynamics.
Conversely, Fortive, a leader in industrial technology, has demonstrated resilience. Despite fluctuations, Fortive's gross profit has grown by nearly 18% over the same period, reaching $3.6 billion in 2023. This growth underscores Fortive's strategic adaptability and market penetration.
While IBM's data for 2024 remains elusive, the trends highlight the contrasting paths of these industry leaders. As the digital age progresses, their financial narratives offer valuable insights into the broader economic shifts.
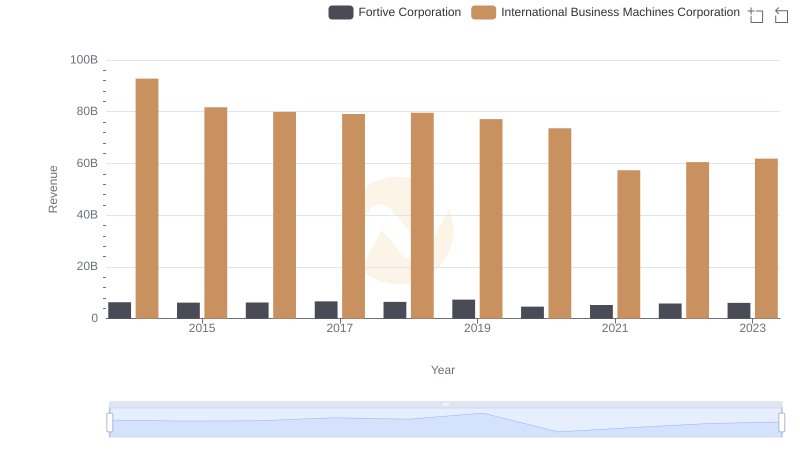
Annual Revenue Comparison: International Business Machines Corporation vs Fortive Corporation
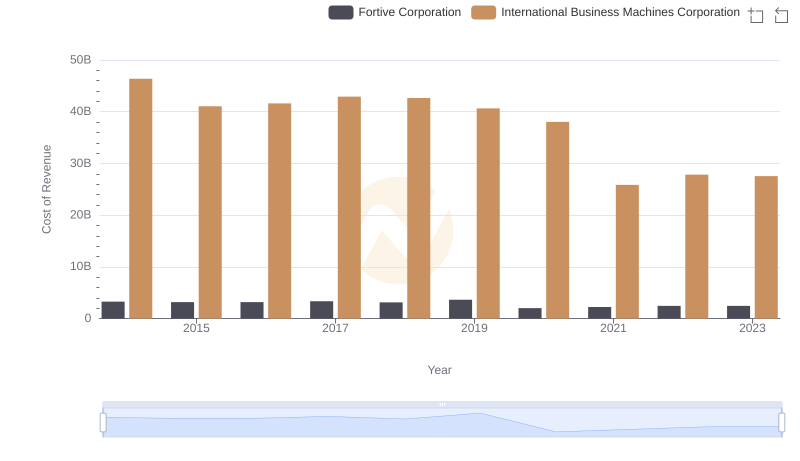
Cost of Revenue Comparison: International Business Machines Corporation vs Fortive Corporation
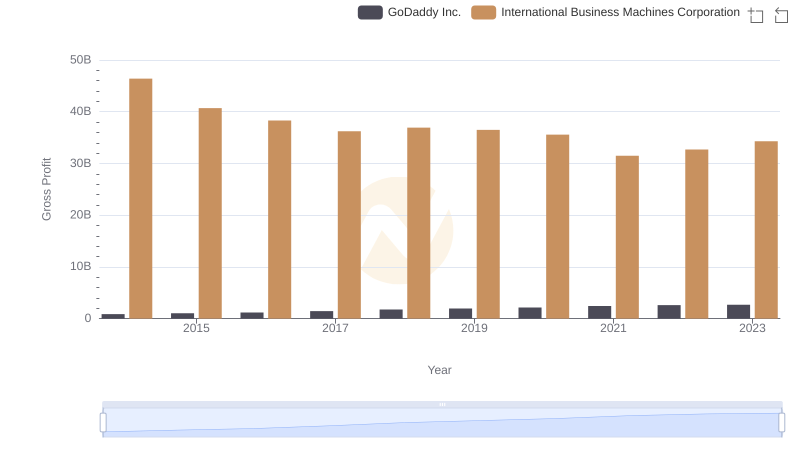
Gross Profit Comparison: International Business Machines Corporation and GoDaddy Inc. Trends
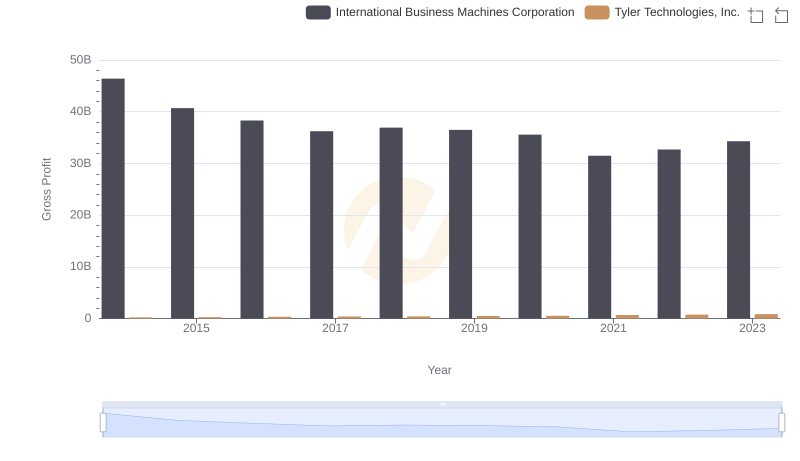
Gross Profit Analysis: Comparing International Business Machines Corporation and Tyler Technologies, Inc.
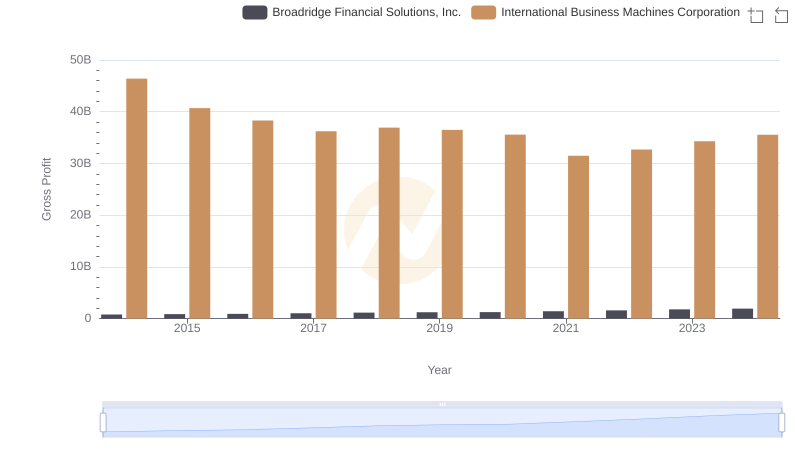
Gross Profit Trends Compared: International Business Machines Corporation vs Broadridge Financial Solutions, Inc.
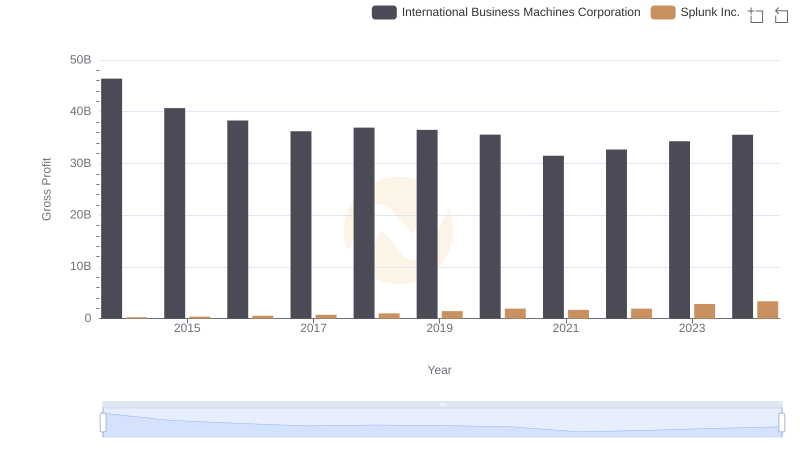
Gross Profit Trends Compared: International Business Machines Corporation vs Splunk Inc.
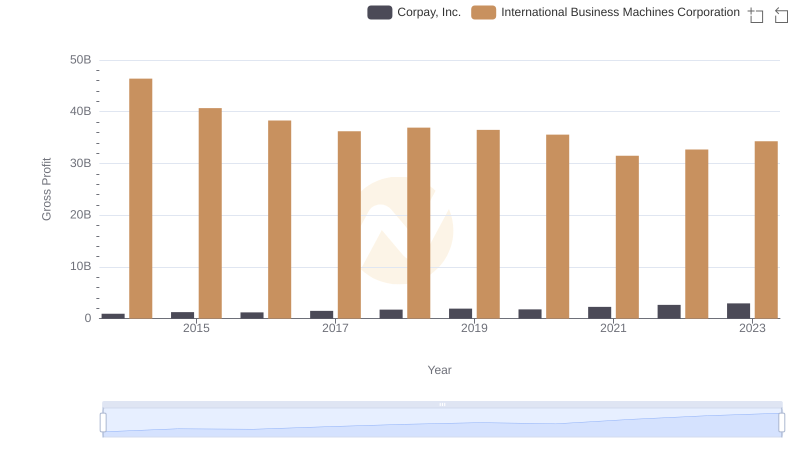
Who Generates Higher Gross Profit? International Business Machines Corporation or Corpay, Inc.
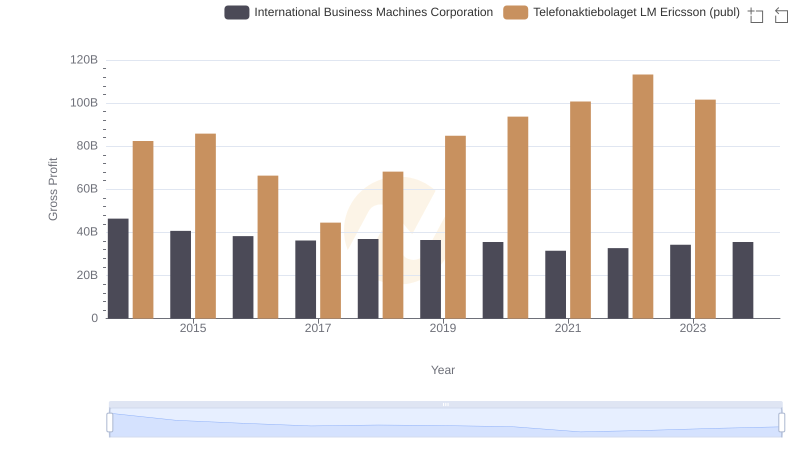
Key Insights on Gross Profit: International Business Machines Corporation vs Telefonaktiebolaget LM Ericsson (publ)
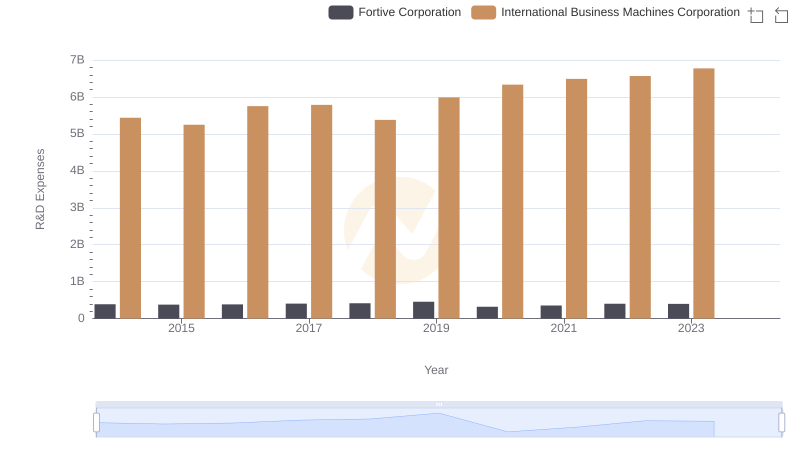
International Business Machines Corporation or Fortive Corporation: Who Invests More in Innovation?
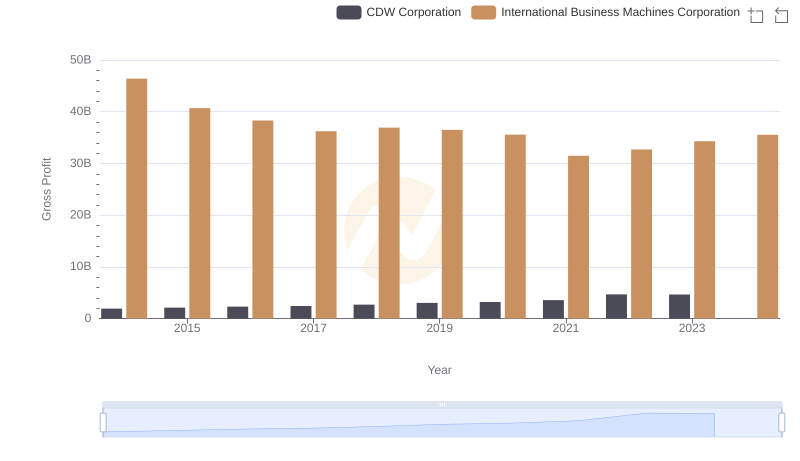
Gross Profit Comparison: International Business Machines Corporation and CDW Corporation Trends
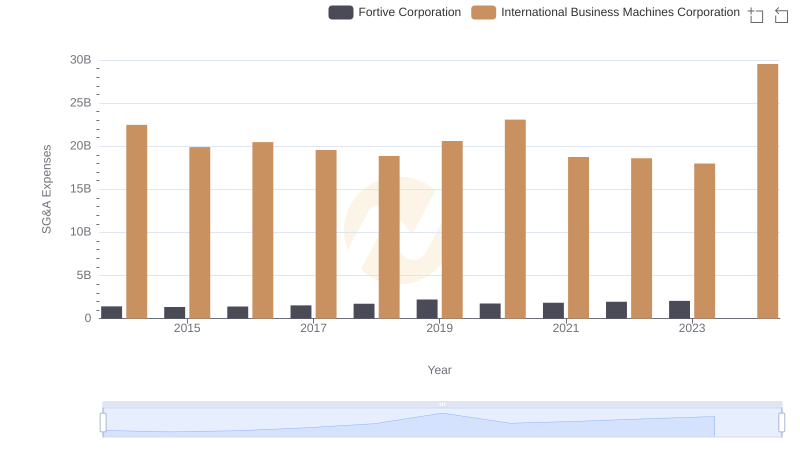
Who Optimizes SG&A Costs Better? International Business Machines Corporation or Fortive Corporation
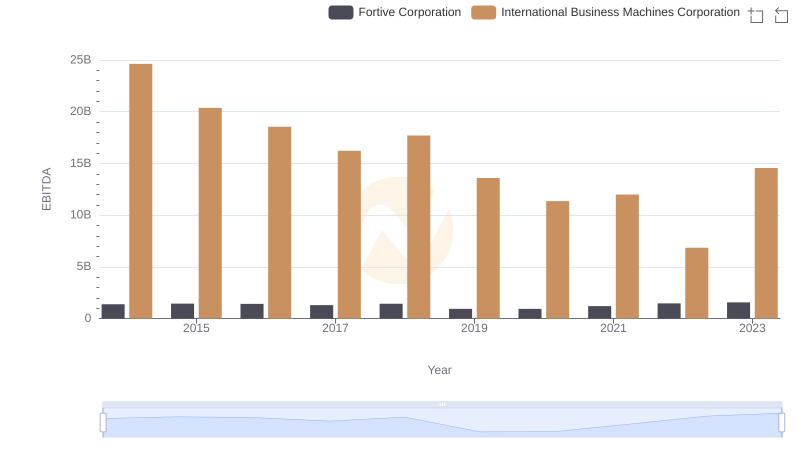
Professional EBITDA Benchmarking: International Business Machines Corporation vs Fortive Corporation