| __timestamp | Fortive Corporation | International Business Machines Corporation |
|---|---|---|
| Wednesday, January 1, 2014 | 6337200000 | 92793000000 |
| Thursday, January 1, 2015 | 6178800000 | 81742000000 |
| Friday, January 1, 2016 | 6224300000 | 79920000000 |
| Sunday, January 1, 2017 | 6656000000 | 79139000000 |
| Monday, January 1, 2018 | 6452700000 | 79591000000 |
| Tuesday, January 1, 2019 | 7320000000 | 57714000000 |
| Wednesday, January 1, 2020 | 4634400000 | 55179000000 |
| Friday, January 1, 2021 | 5254700000 | 57351000000 |
| Saturday, January 1, 2022 | 5825700000 | 60530000000 |
| Sunday, January 1, 2023 | 6065300000 | 61860000000 |
| Monday, January 1, 2024 | 6231800000 | 62753000000 |
Unveiling the hidden dimensions of data
In the ever-evolving landscape of technology and industrial solutions, International Business Machines Corporation (IBM) and Fortive Corporation stand as titans, each with a unique trajectory. Over the past decade, IBM's annual revenue has seen a decline from its peak in 2014, dropping by approximately 32% by 2023. This reflects the company's strategic shift towards cloud computing and AI, amidst a challenging market environment.
Conversely, Fortive, a leader in industrial technology, has demonstrated resilience. Despite a dip in 2020, likely due to global disruptions, Fortive's revenue rebounded by 31% by 2023, showcasing its robust business model and adaptability.
As we look to the future, the data for 2024 remains incomplete, leaving room for speculation. Will IBM's transformation strategy pay off? Can Fortive maintain its growth momentum? Only time will tell.
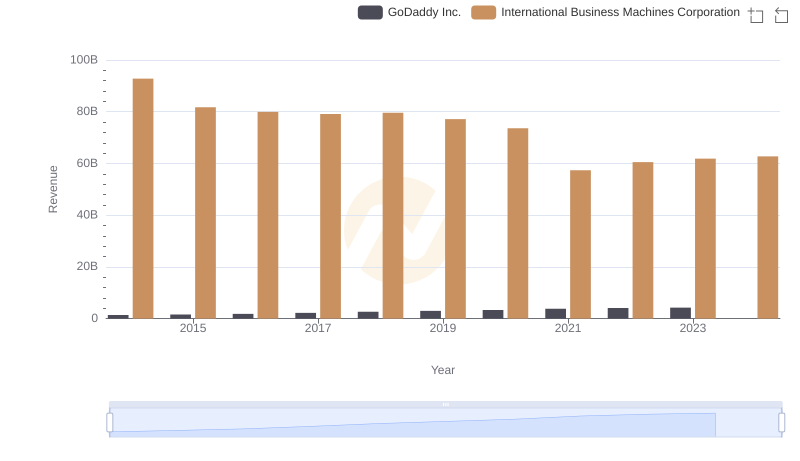
Who Generates More Revenue? International Business Machines Corporation or GoDaddy Inc.
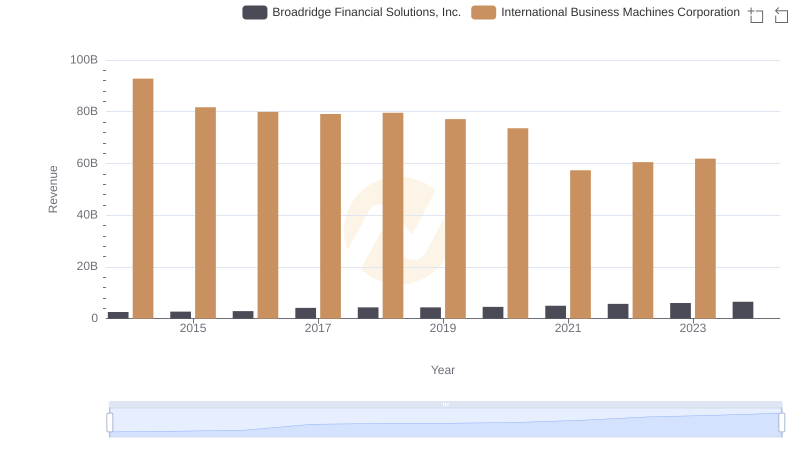
Revenue Insights: International Business Machines Corporation and Broadridge Financial Solutions, Inc. Performance Compared
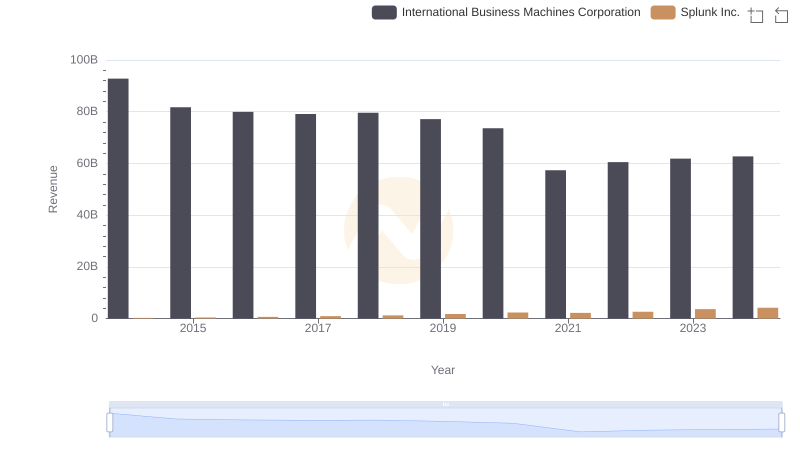
Comparing Revenue Performance: International Business Machines Corporation or Splunk Inc.?
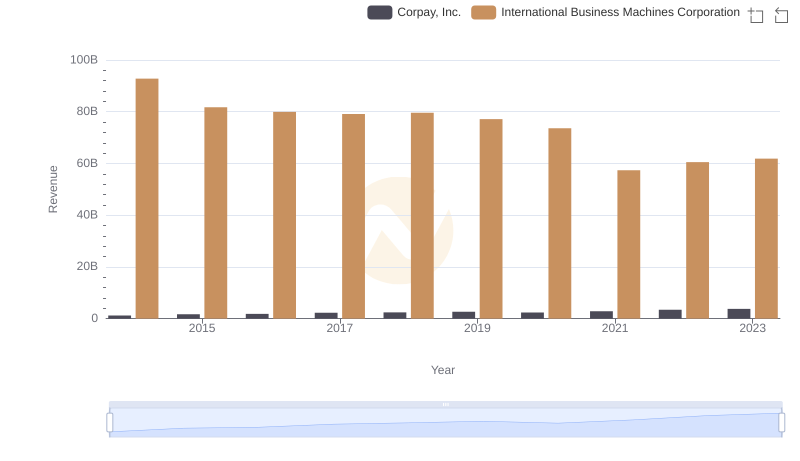
Comparing Revenue Performance: International Business Machines Corporation or Corpay, Inc.?
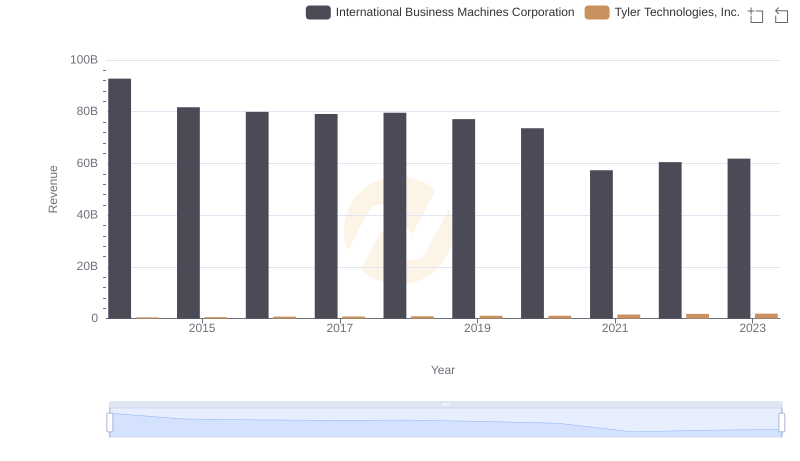
International Business Machines Corporation vs Tyler Technologies, Inc.: Examining Key Revenue Metrics
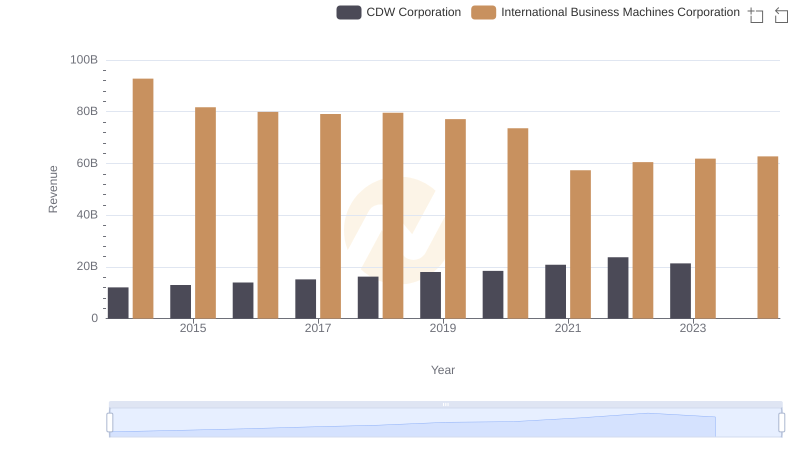
Who Generates More Revenue? International Business Machines Corporation or CDW Corporation
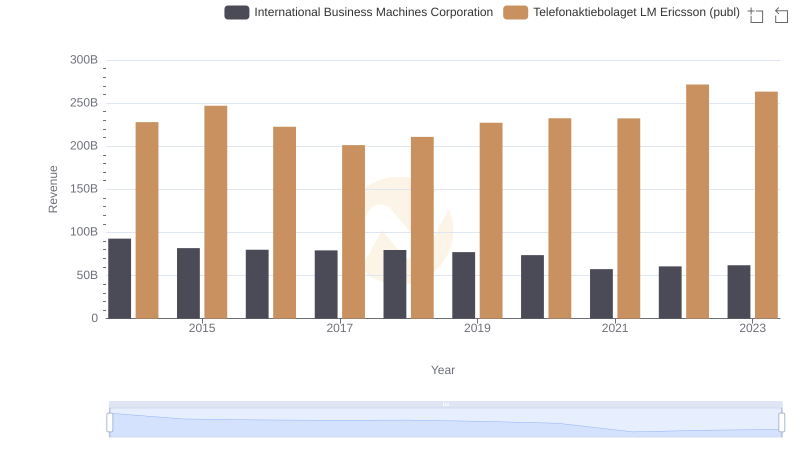
Comparing Revenue Performance: International Business Machines Corporation or Telefonaktiebolaget LM Ericsson (publ)?
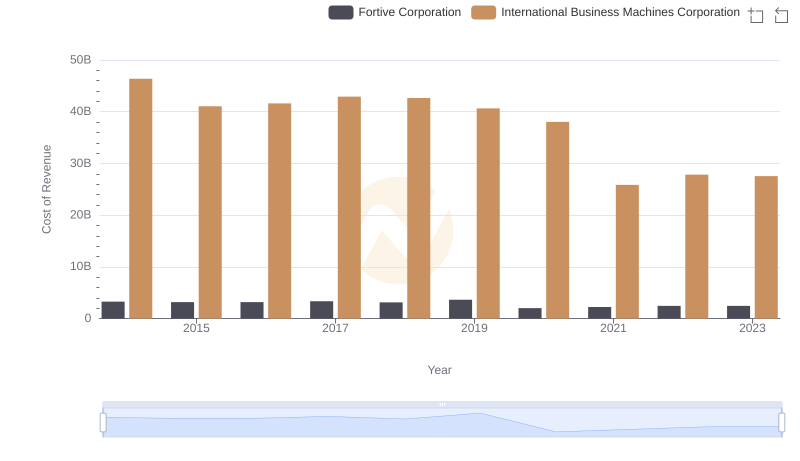
Cost of Revenue Comparison: International Business Machines Corporation vs Fortive Corporation
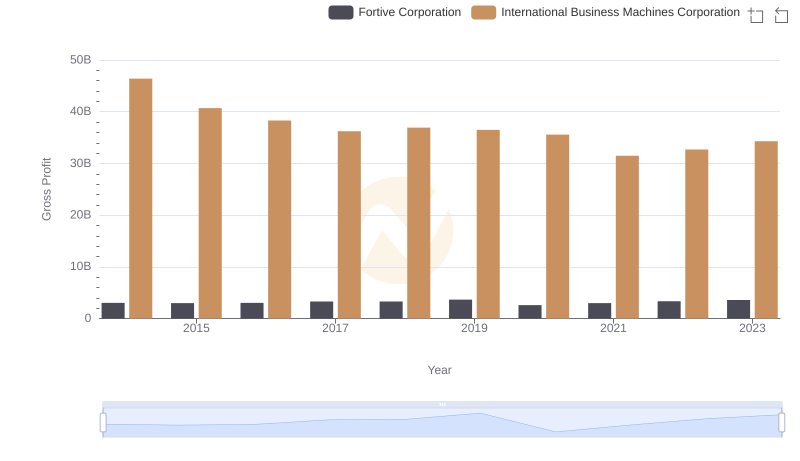
International Business Machines Corporation and Fortive Corporation: A Detailed Gross Profit Analysis
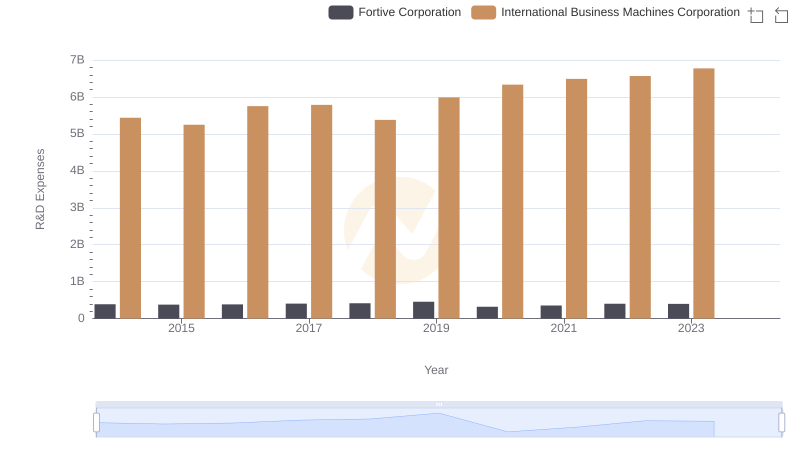
International Business Machines Corporation or Fortive Corporation: Who Invests More in Innovation?
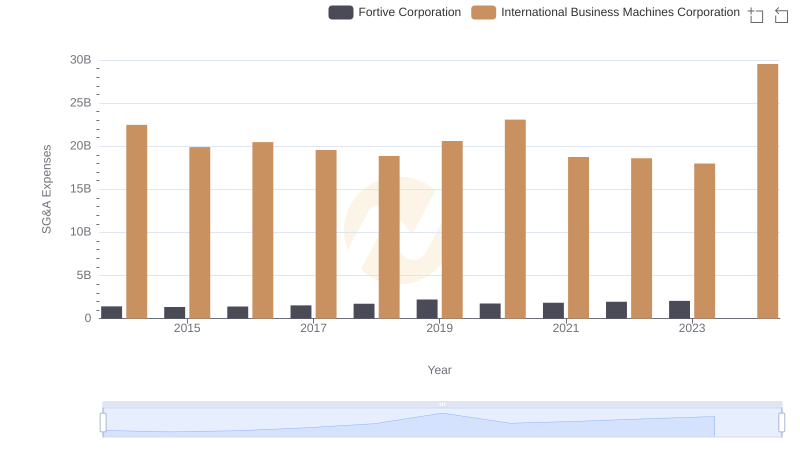
Who Optimizes SG&A Costs Better? International Business Machines Corporation or Fortive Corporation
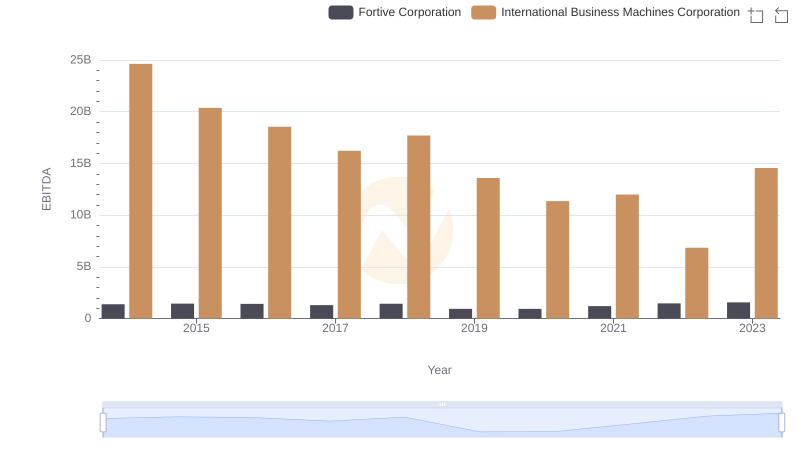
Professional EBITDA Benchmarking: International Business Machines Corporation vs Fortive Corporation