| __timestamp | Fortive Corporation | International Business Machines Corporation |
|---|---|---|
| Wednesday, January 1, 2014 | 1416300000 | 22472000000 |
| Thursday, January 1, 2015 | 1347900000 | 19894000000 |
| Friday, January 1, 2016 | 1402000000 | 20279000000 |
| Sunday, January 1, 2017 | 1537600000 | 19680000000 |
| Monday, January 1, 2018 | 1728600000 | 19366000000 |
| Tuesday, January 1, 2019 | 2219500000 | 18724000000 |
| Wednesday, January 1, 2020 | 1748400000 | 20561000000 |
| Friday, January 1, 2021 | 1839500000 | 18745000000 |
| Saturday, January 1, 2022 | 1956600000 | 17483000000 |
| Sunday, January 1, 2023 | 2062600000 | 17997000000 |
| Monday, January 1, 2024 | 2173500000 | 29536000000 |
Unleashing insights
In the competitive world of corporate finance, managing Selling, General, and Administrative (SG&A) expenses is crucial for profitability. This analysis pits two industry titans, Fortive Corporation and International Business Machines Corporation (IBM), against each other in a battle of cost efficiency from 2014 to 2023.
Over the past decade, IBM's SG&A expenses have consistently dwarfed those of Fortive, averaging around 20 times higher. However, Fortive has shown a steady increase in its SG&A expenses, peaking in 2019 with a 55% rise from 2014. Meanwhile, IBM's expenses have fluctuated, with a notable dip in 2023, marking a 20% decrease from its 2014 figures.
Interestingly, Fortive's data for 2024 is missing, leaving a gap in the analysis. This absence highlights the importance of complete data for accurate financial insights.
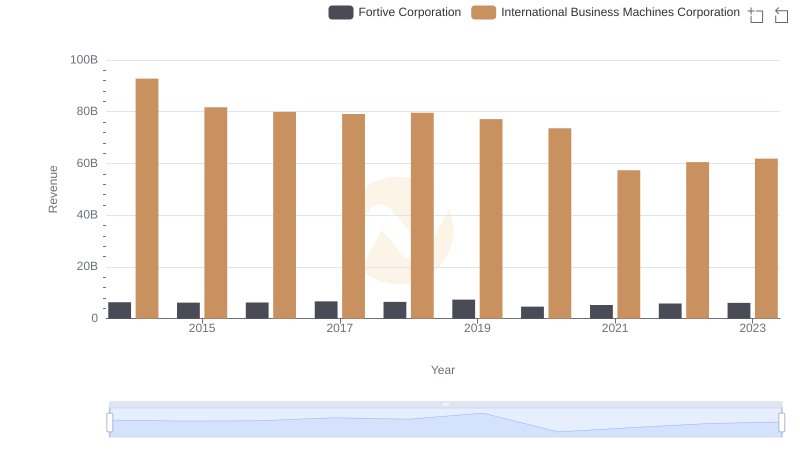
Annual Revenue Comparison: International Business Machines Corporation vs Fortive Corporation
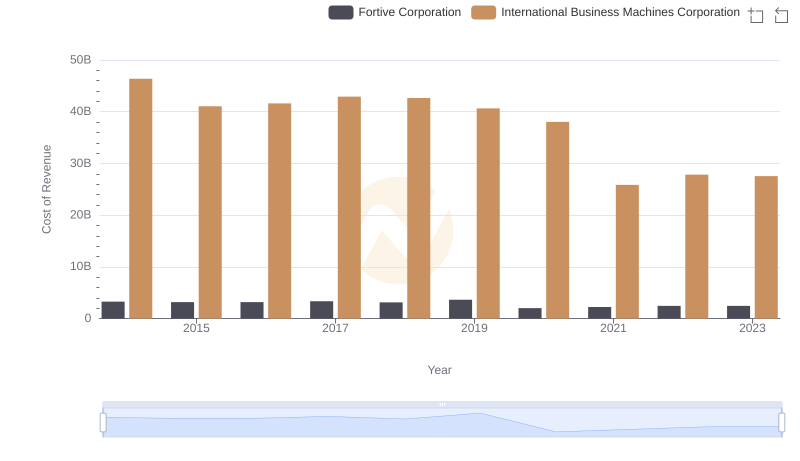
Cost of Revenue Comparison: International Business Machines Corporation vs Fortive Corporation
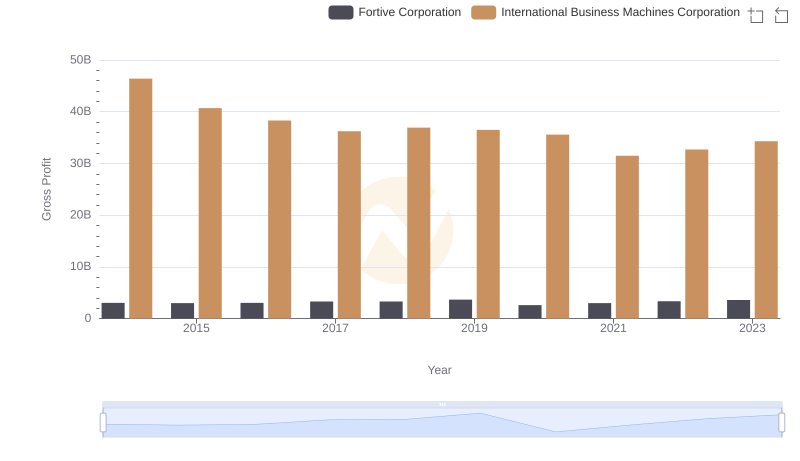
International Business Machines Corporation and Fortive Corporation: A Detailed Gross Profit Analysis
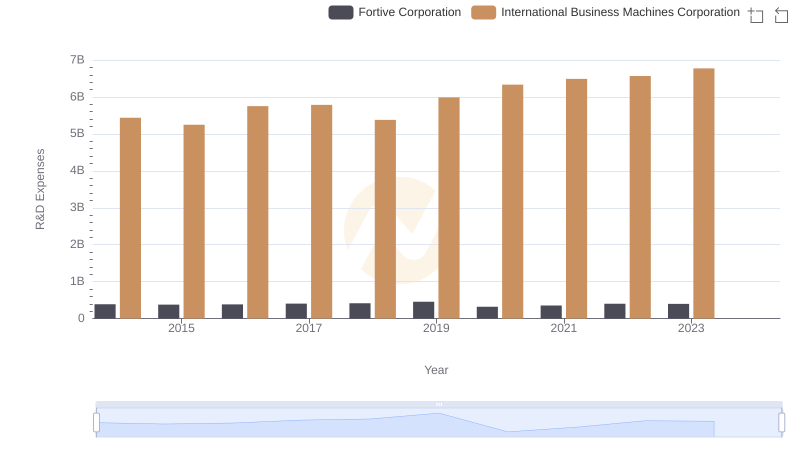
International Business Machines Corporation or Fortive Corporation: Who Invests More in Innovation?
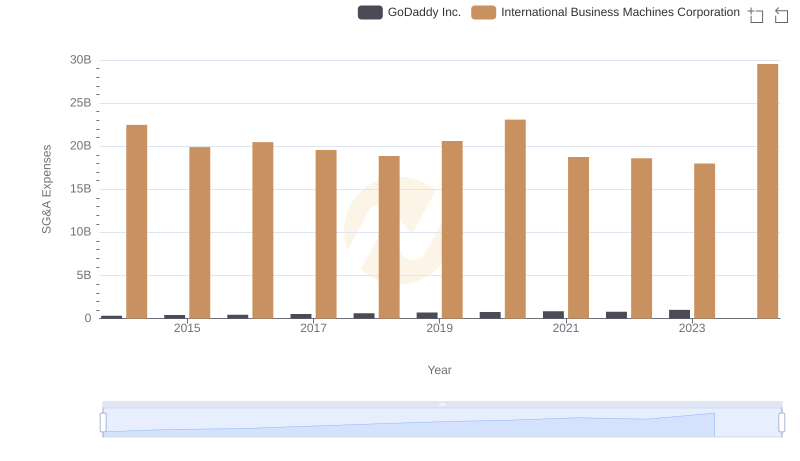
Cost Management Insights: SG&A Expenses for International Business Machines Corporation and GoDaddy Inc.
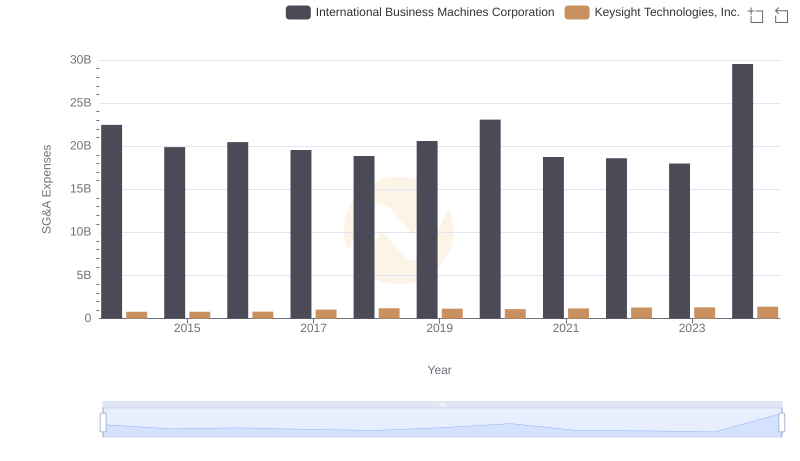
Cost Management Insights: SG&A Expenses for International Business Machines Corporation and Keysight Technologies, Inc.
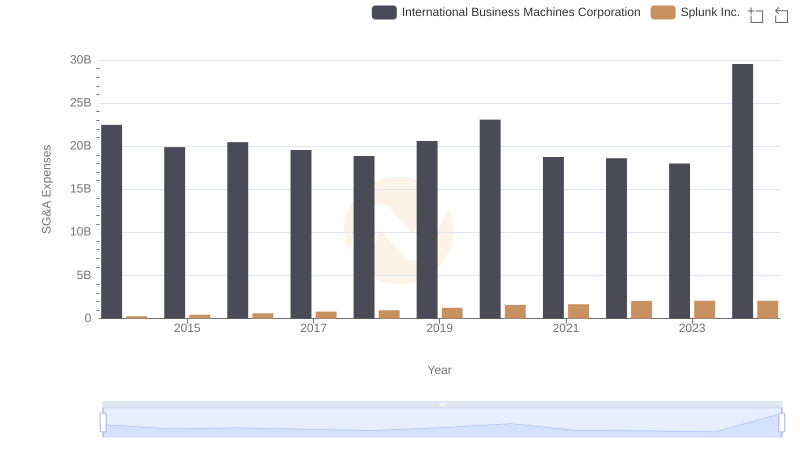
Selling, General, and Administrative Costs: International Business Machines Corporation vs Splunk Inc.

Breaking Down SG&A Expenses: International Business Machines Corporation vs Corpay, Inc.
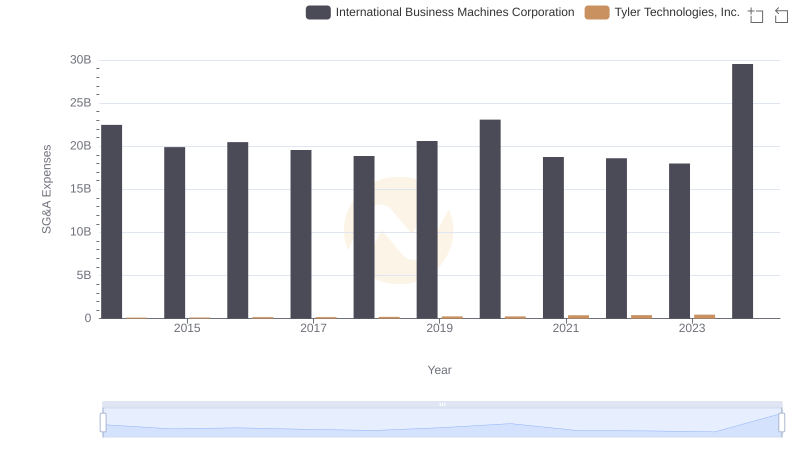
Comparing SG&A Expenses: International Business Machines Corporation vs Tyler Technologies, Inc. Trends and Insights
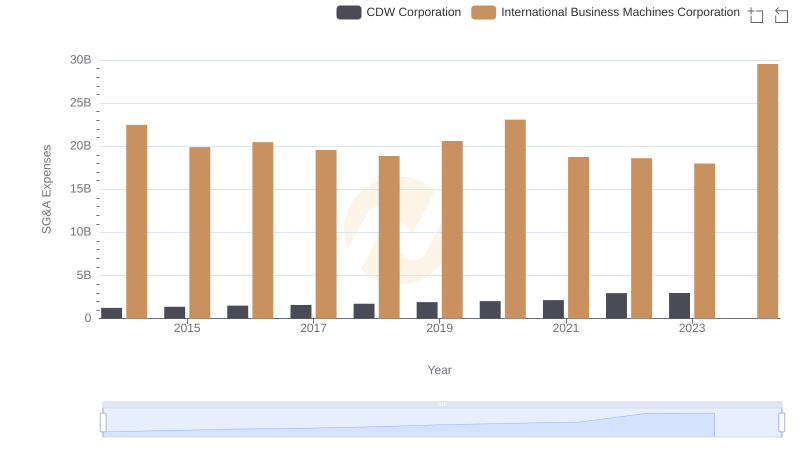
International Business Machines Corporation vs CDW Corporation: SG&A Expense Trends
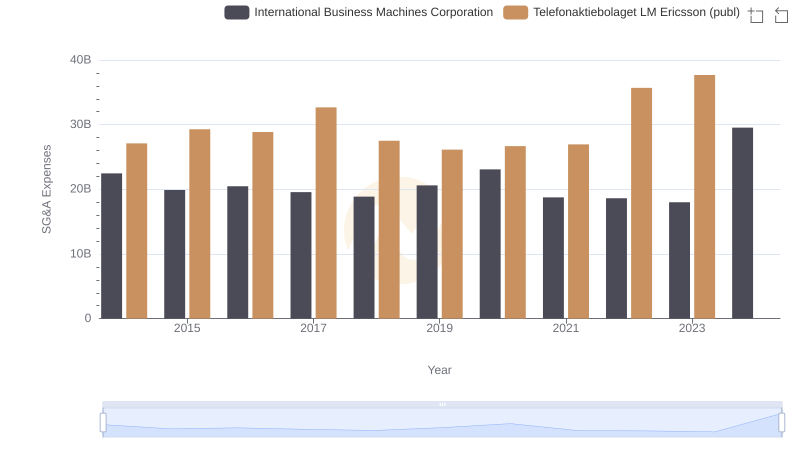
International Business Machines Corporation vs Telefonaktiebolaget LM Ericsson (publ): SG&A Expense Trends
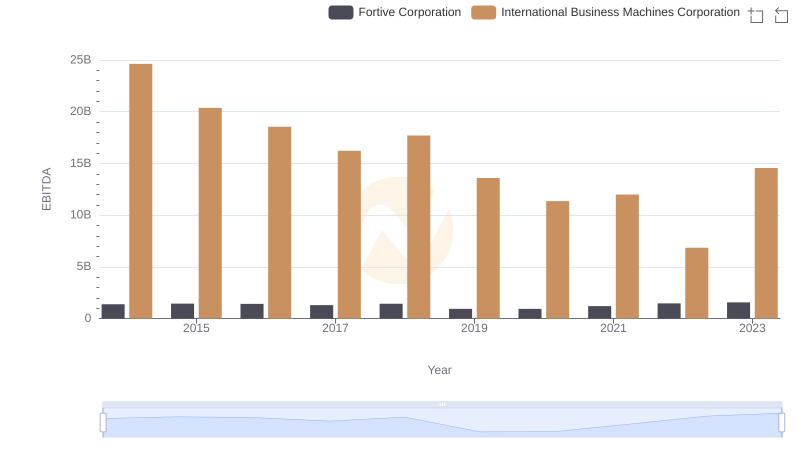
Professional EBITDA Benchmarking: International Business Machines Corporation vs Fortive Corporation