| __timestamp | Corpay, Inc. | International Business Machines Corporation |
|---|---|---|
| Wednesday, January 1, 2014 | 269591000 | 46386000000 |
| Thursday, January 1, 2015 | 439330000 | 41057000000 |
| Friday, January 1, 2016 | 621965000 | 41403000000 |
| Sunday, January 1, 2017 | 756337000 | 42196000000 |
| Monday, January 1, 2018 | 692584000 | 42655000000 |
| Tuesday, January 1, 2019 | 726044000 | 26181000000 |
| Wednesday, January 1, 2020 | 596363000 | 24314000000 |
| Friday, January 1, 2021 | 559819000 | 25865000000 |
| Saturday, January 1, 2022 | 764707000 | 27842000000 |
| Sunday, January 1, 2023 | 819908000 | 27560000000 |
| Monday, January 1, 2024 | 0 | 27202000000 |
Unlocking the unknown
In the ever-evolving landscape of technology and financial services, understanding cost structures is crucial. This analysis delves into the cost of revenue for two industry giants: International Business Machines Corporation (IBM) and Corpay, Inc., from 2014 to 2023.
IBM, a stalwart in the tech industry, has seen its cost of revenue decrease by approximately 41% over the decade, from a peak in 2014 to a low in 2023. This trend reflects IBM's strategic shift towards more efficient operations and a focus on high-margin services.
Conversely, Corpay, Inc., a rising star in financial services, has experienced a 204% increase in its cost of revenue, indicating rapid growth and expansion. This surge underscores Corpay's aggressive market penetration and scaling efforts.
The data for 2024 is incomplete, highlighting the dynamic nature of these industries and the need for continuous monitoring.
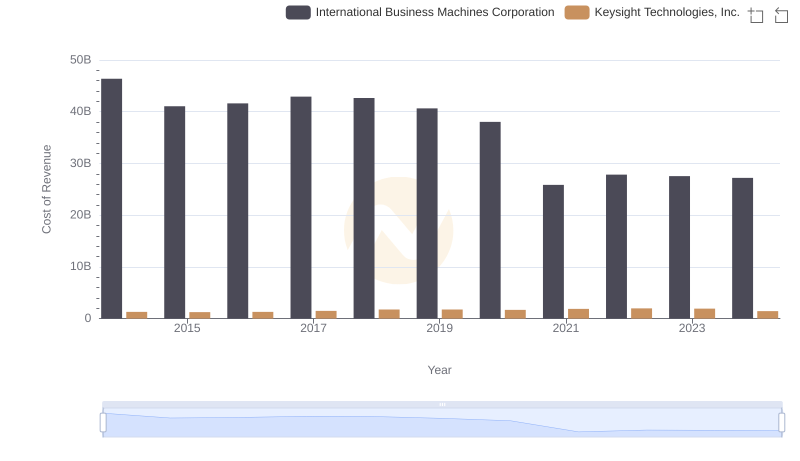
Cost of Revenue Trends: International Business Machines Corporation vs Keysight Technologies, Inc.
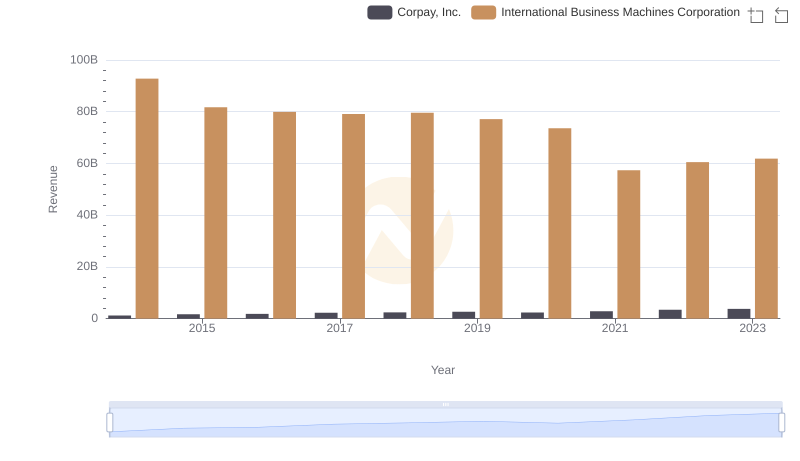
Comparing Revenue Performance: International Business Machines Corporation or Corpay, Inc.?
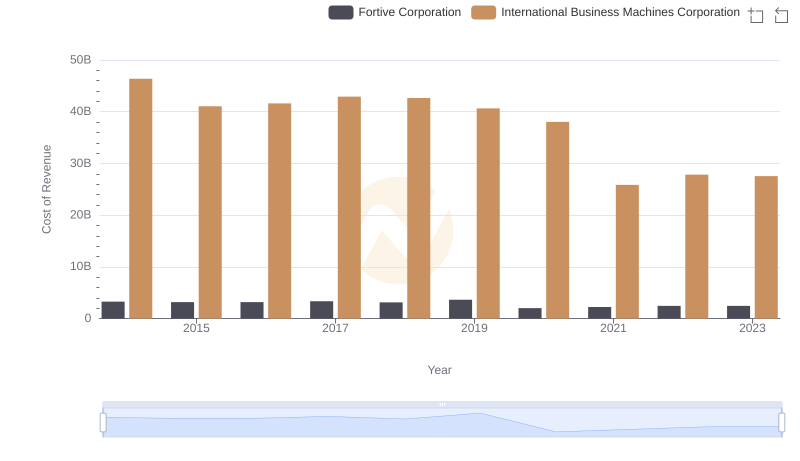
Cost of Revenue Comparison: International Business Machines Corporation vs Fortive Corporation

Analyzing Cost of Revenue: International Business Machines Corporation and Broadridge Financial Solutions, Inc.
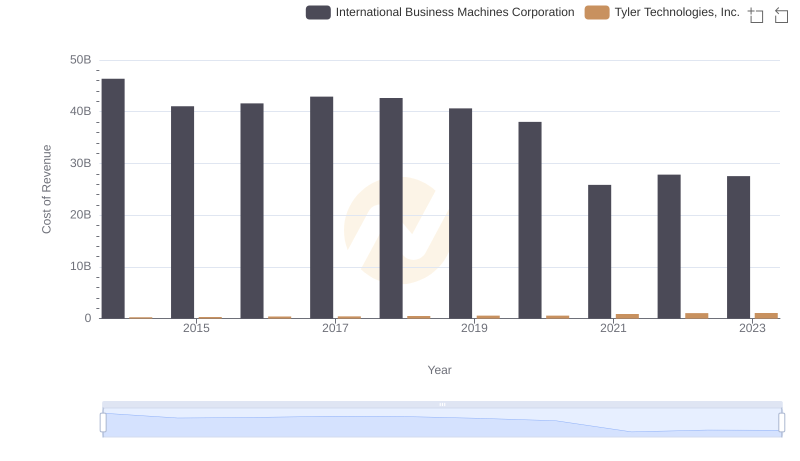
Cost of Revenue: Key Insights for International Business Machines Corporation and Tyler Technologies, Inc.
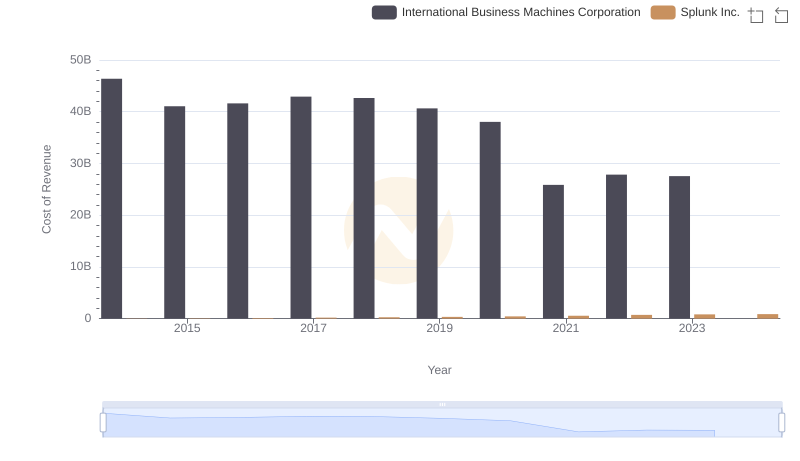
Cost of Revenue Comparison: International Business Machines Corporation vs Splunk Inc.
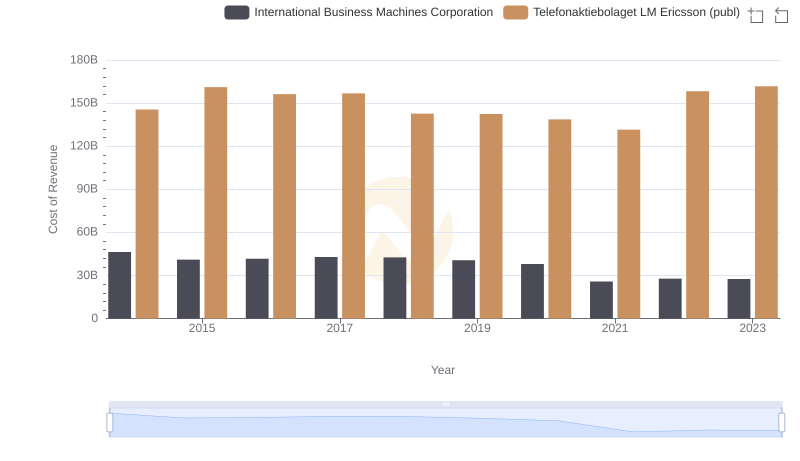
Cost of Revenue Trends: International Business Machines Corporation vs Telefonaktiebolaget LM Ericsson (publ)
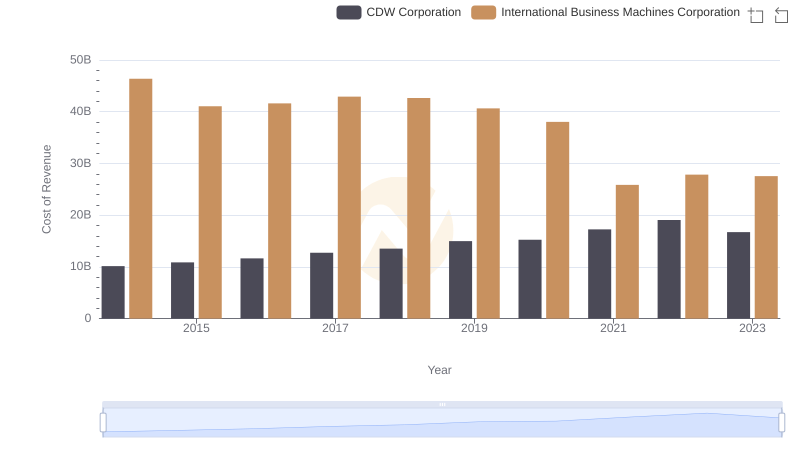
Analyzing Cost of Revenue: International Business Machines Corporation and CDW Corporation
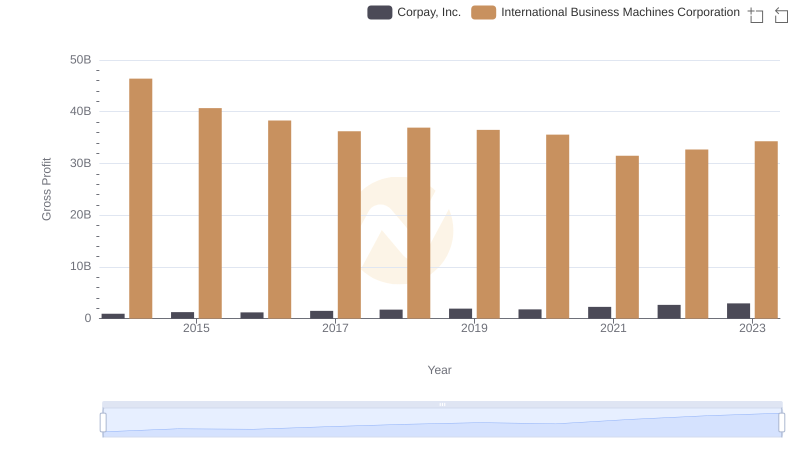
Who Generates Higher Gross Profit? International Business Machines Corporation or Corpay, Inc.
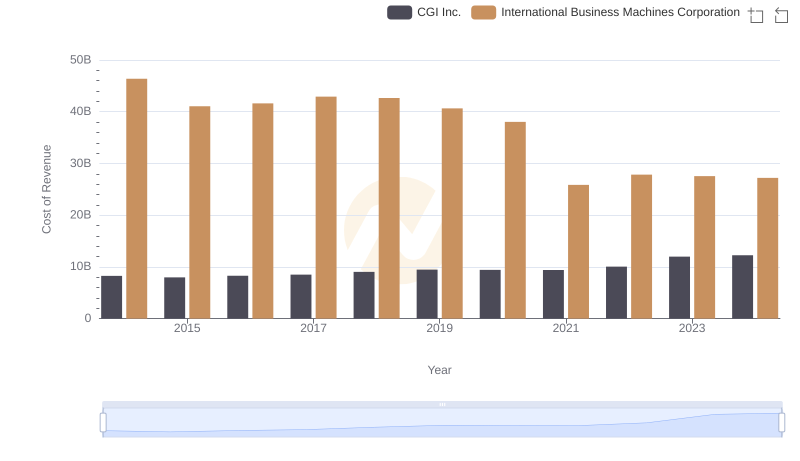
Cost of Revenue Comparison: International Business Machines Corporation vs CGI Inc.
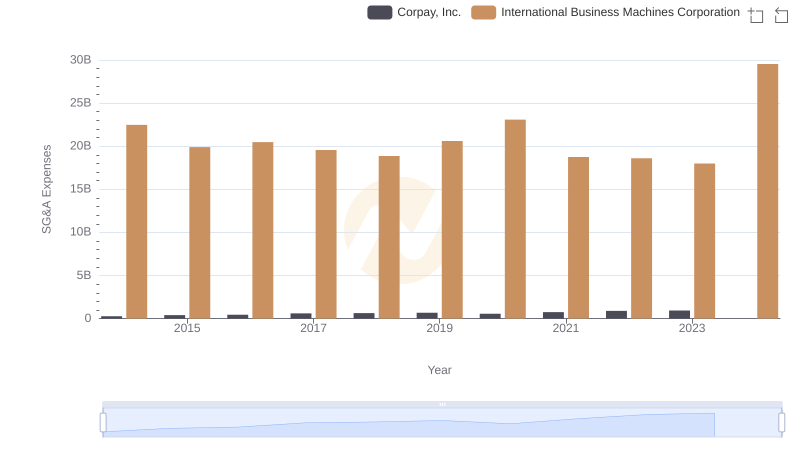
Breaking Down SG&A Expenses: International Business Machines Corporation vs Corpay, Inc.
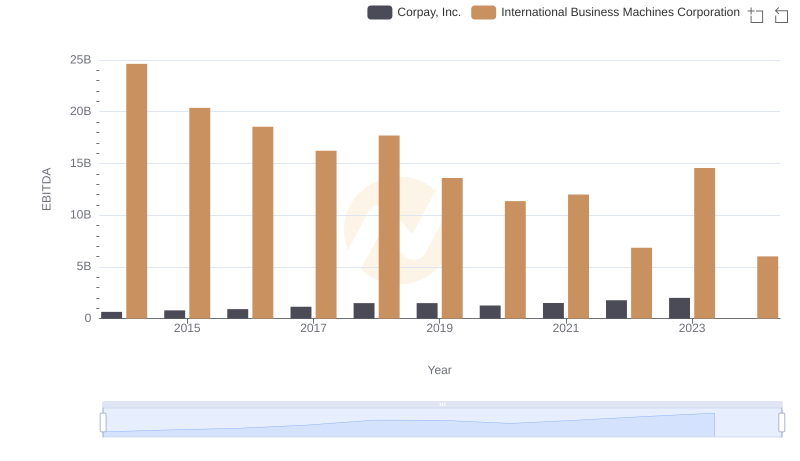
Professional EBITDA Benchmarking: International Business Machines Corporation vs Corpay, Inc.