| __timestamp | Corpay, Inc. | International Business Machines Corporation |
|---|---|---|
| Wednesday, January 1, 2014 | 281490000 | 22472000000 |
| Thursday, January 1, 2015 | 406790000 | 19894000000 |
| Friday, January 1, 2016 | 450953000 | 20279000000 |
| Sunday, January 1, 2017 | 603268000 | 19680000000 |
| Monday, January 1, 2018 | 631142000 | 19366000000 |
| Tuesday, January 1, 2019 | 683511000 | 18724000000 |
| Wednesday, January 1, 2020 | 567410000 | 20561000000 |
| Friday, January 1, 2021 | 747948000 | 18745000000 |
| Saturday, January 1, 2022 | 893217000 | 17483000000 |
| Sunday, January 1, 2023 | 943581000 | 17997000000 |
| Monday, January 1, 2024 | 997780000 | 29536000000 |
Unveiling the hidden dimensions of data
In the ever-evolving landscape of corporate finance, understanding the nuances of Selling, General, and Administrative (SG&A) expenses is crucial. This analysis delves into the SG&A expenses of two industry giants: International Business Machines Corporation (IBM) and Corpay, Inc., from 2014 to 2023.
IBM, a stalwart in the tech industry, consistently reported SG&A expenses averaging around $20 billion annually, with a notable peak in 2024. In contrast, Corpay, a leader in financial technology, exhibited a steady growth in SG&A expenses, starting at approximately $281 million in 2014 and reaching nearly $944 million by 2023. This represents a staggering 235% increase over the decade.
The data highlights IBM's significant investment in administrative functions, while Corpay's rapid growth reflects its expanding market presence. Missing data for Corpay in 2024 suggests a potential shift or anomaly worth further exploration.
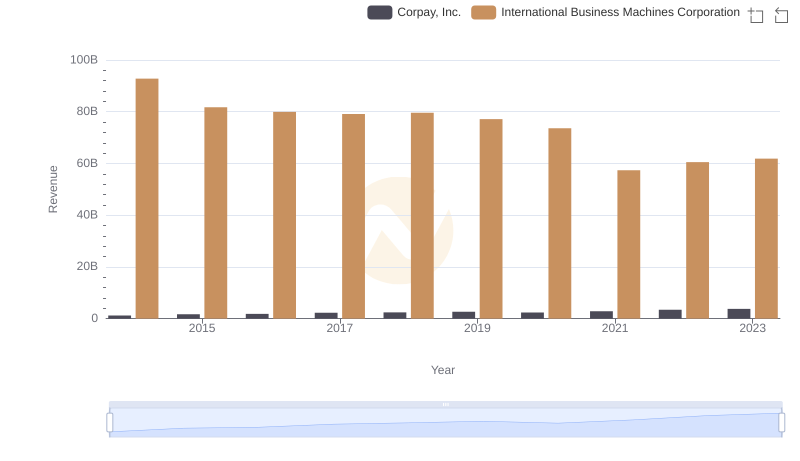
Comparing Revenue Performance: International Business Machines Corporation or Corpay, Inc.?
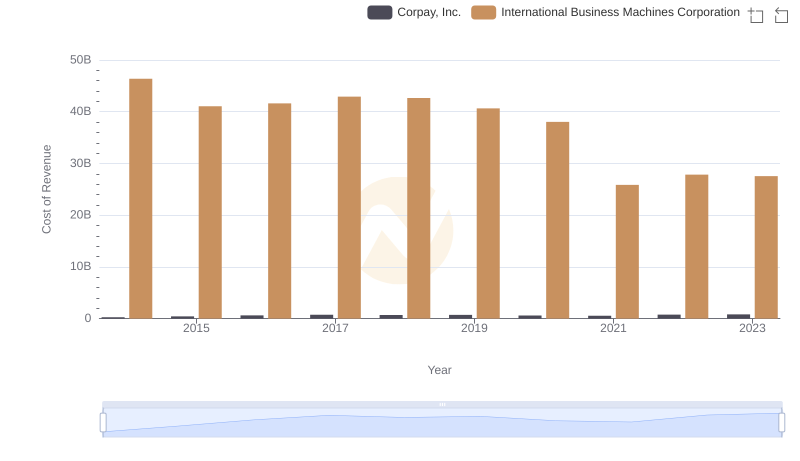
Analyzing Cost of Revenue: International Business Machines Corporation and Corpay, Inc.
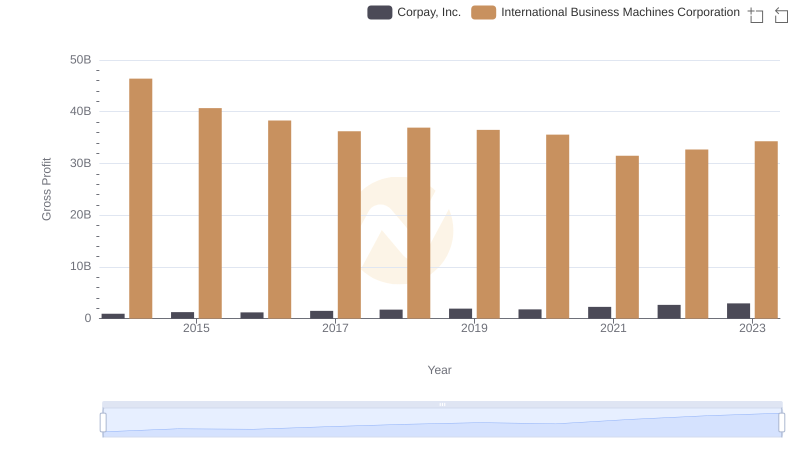
Who Generates Higher Gross Profit? International Business Machines Corporation or Corpay, Inc.
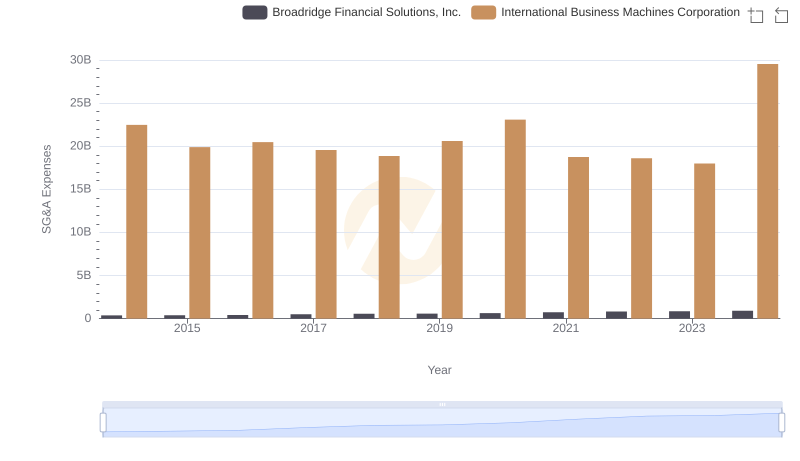
Operational Costs Compared: SG&A Analysis of International Business Machines Corporation and Broadridge Financial Solutions, Inc.
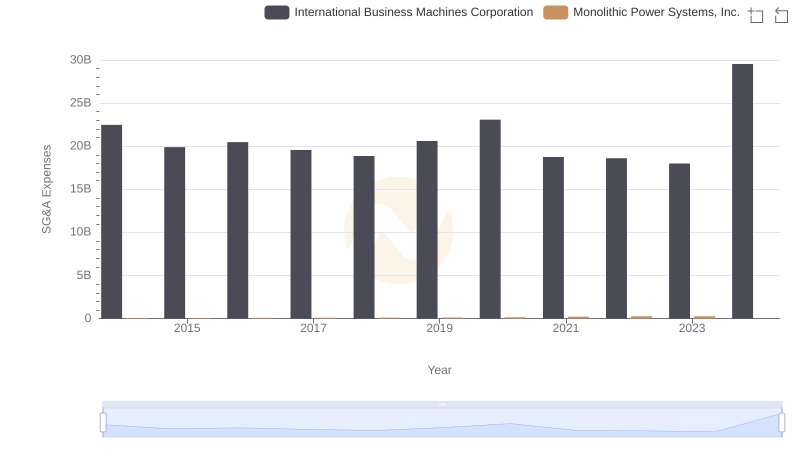
SG&A Efficiency Analysis: Comparing International Business Machines Corporation and Monolithic Power Systems, Inc.
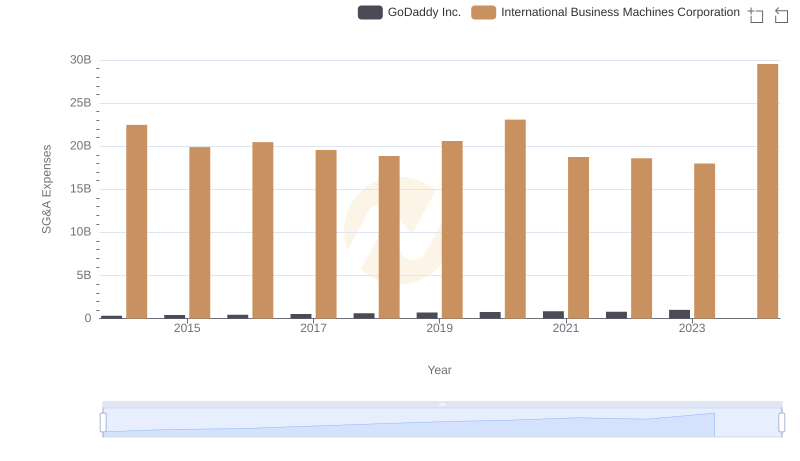
Cost Management Insights: SG&A Expenses for International Business Machines Corporation and GoDaddy Inc.
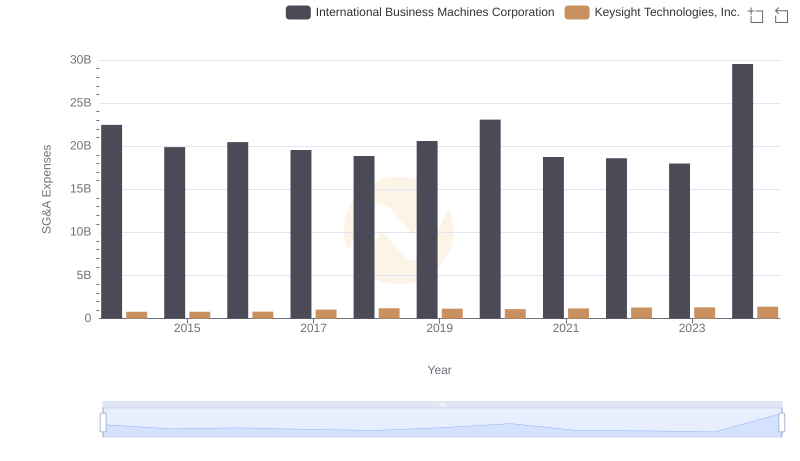
Cost Management Insights: SG&A Expenses for International Business Machines Corporation and Keysight Technologies, Inc.
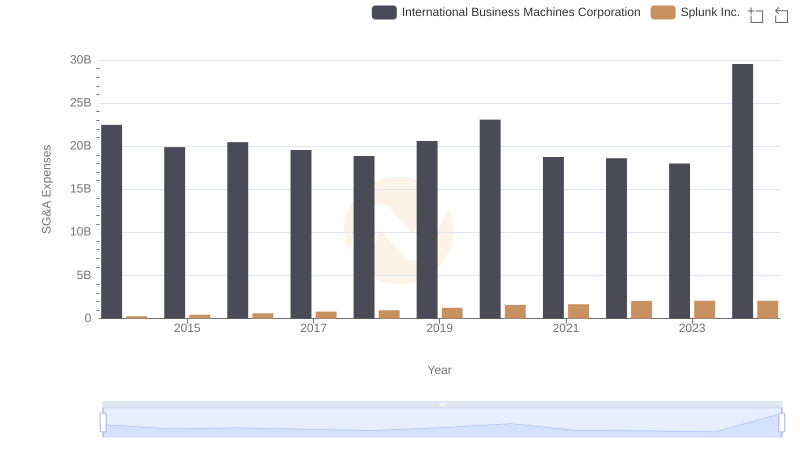
Selling, General, and Administrative Costs: International Business Machines Corporation vs Splunk Inc.
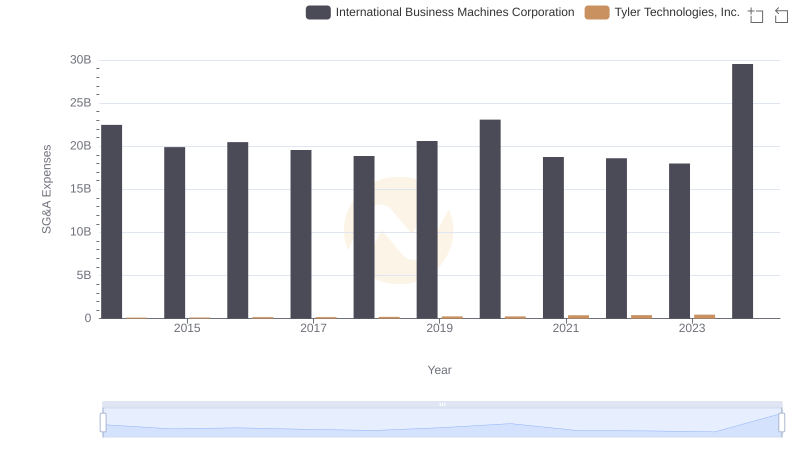
Comparing SG&A Expenses: International Business Machines Corporation vs Tyler Technologies, Inc. Trends and Insights
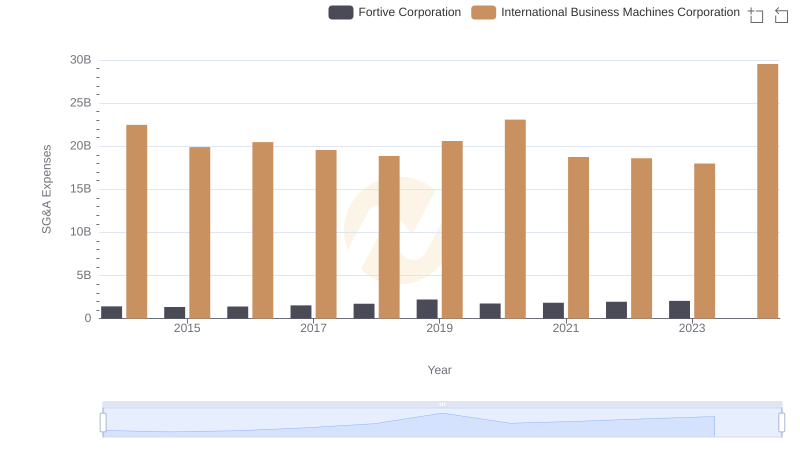
Who Optimizes SG&A Costs Better? International Business Machines Corporation or Fortive Corporation
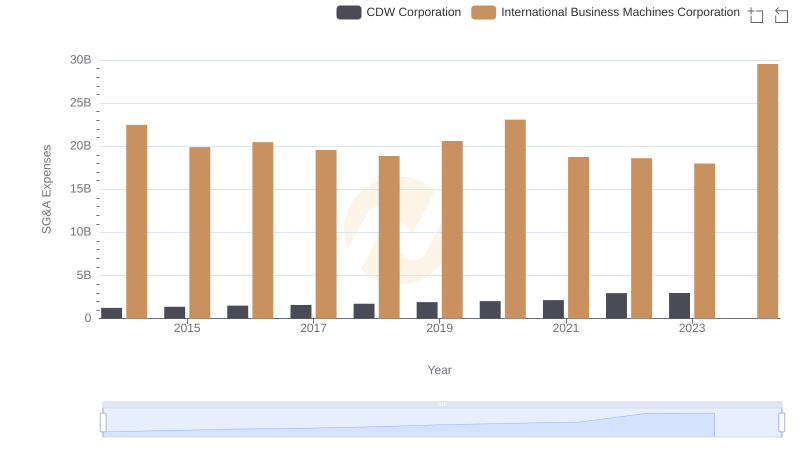
International Business Machines Corporation vs CDW Corporation: SG&A Expense Trends
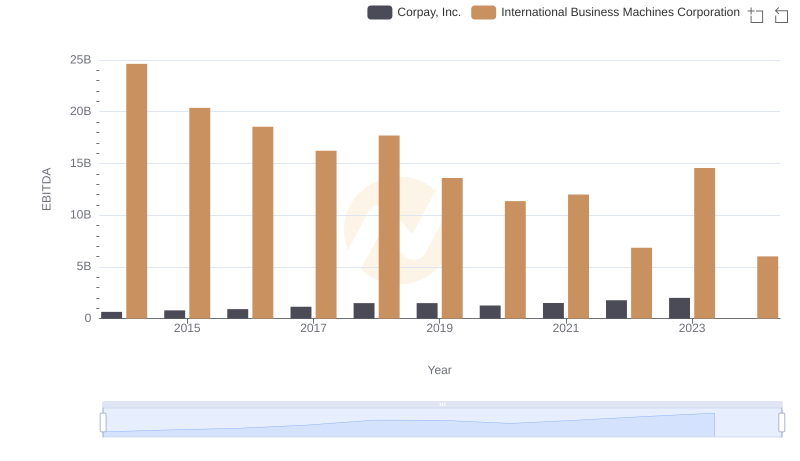
Professional EBITDA Benchmarking: International Business Machines Corporation vs Corpay, Inc.