| __timestamp | Corpay, Inc. | International Business Machines Corporation |
|---|---|---|
| Wednesday, January 1, 2014 | 1199390000 | 92793000000 |
| Thursday, January 1, 2015 | 1702865000 | 81742000000 |
| Friday, January 1, 2016 | 1831546000 | 79920000000 |
| Sunday, January 1, 2017 | 2249538000 | 79139000000 |
| Monday, January 1, 2018 | 2433492000 | 79591000000 |
| Tuesday, January 1, 2019 | 2648848000 | 57714000000 |
| Wednesday, January 1, 2020 | 2388855000 | 55179000000 |
| Friday, January 1, 2021 | 2833736000 | 57351000000 |
| Saturday, January 1, 2022 | 3427129000 | 60530000000 |
| Sunday, January 1, 2023 | 3757719000 | 61860000000 |
| Monday, January 1, 2024 | 3974589000 | 62753000000 |
Unleashing insights
In the ever-evolving landscape of technology and finance, the revenue trajectories of International Business Machines Corporation (IBM) and Corpay, Inc. offer a fascinating study. Over the past decade, IBM, a stalwart in the tech industry, has seen its revenue decline by approximately 33%, from a peak of $92.8 billion in 2014 to $61.9 billion in 2023. This trend reflects the challenges faced by traditional tech giants in adapting to new market dynamics.
Conversely, Corpay, Inc., a rising star in the financial services sector, has experienced a remarkable revenue growth of over 200% during the same period, climbing from $1.2 billion in 2014 to $3.8 billion in 2023. This growth underscores the increasing demand for innovative financial solutions. As we look to the future, the contrasting revenue paths of these two companies highlight the shifting tides in their respective industries.
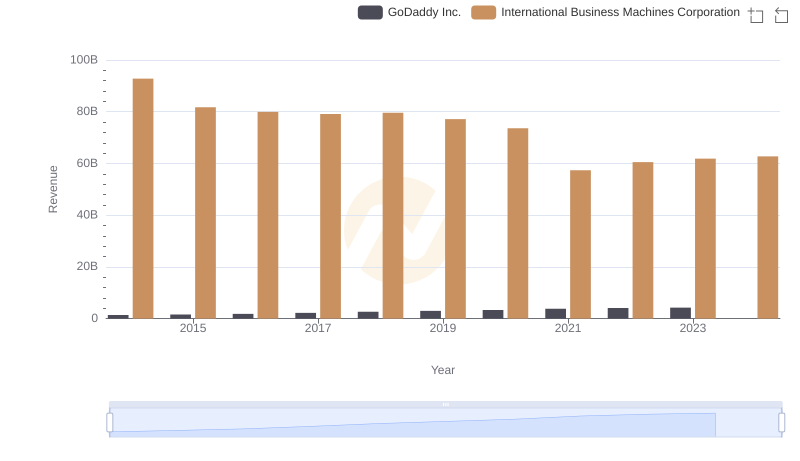
Who Generates More Revenue? International Business Machines Corporation or GoDaddy Inc.
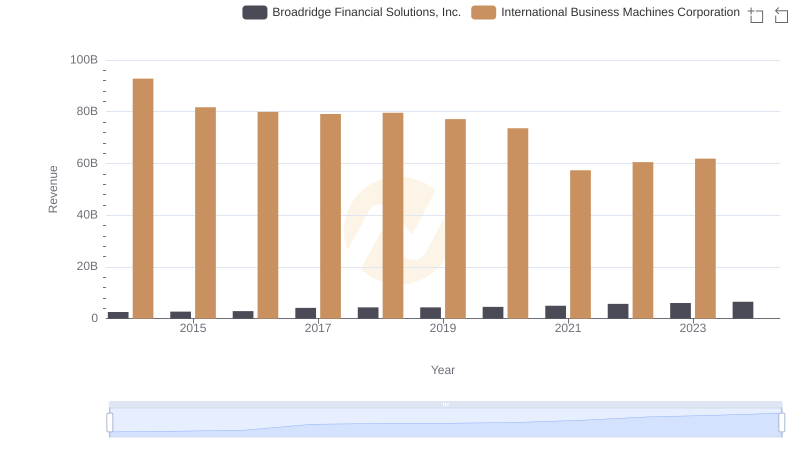
Revenue Insights: International Business Machines Corporation and Broadridge Financial Solutions, Inc. Performance Compared
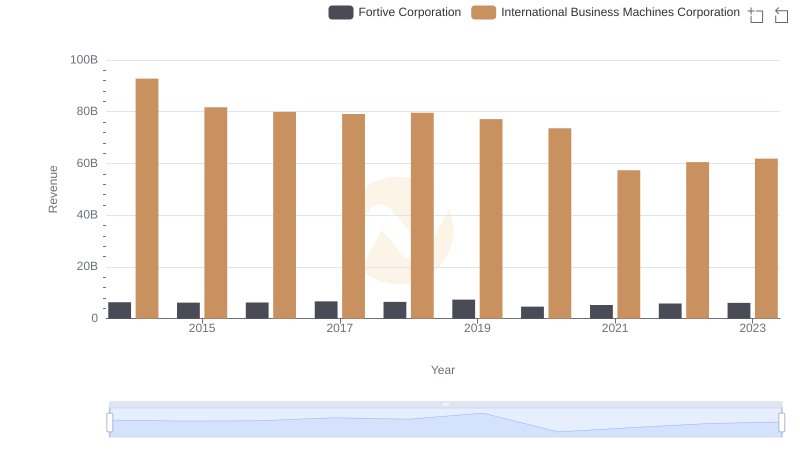
Annual Revenue Comparison: International Business Machines Corporation vs Fortive Corporation
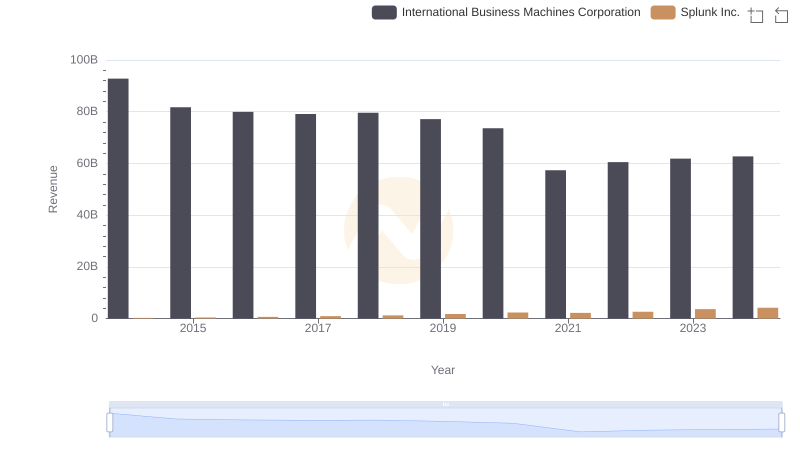
Comparing Revenue Performance: International Business Machines Corporation or Splunk Inc.?
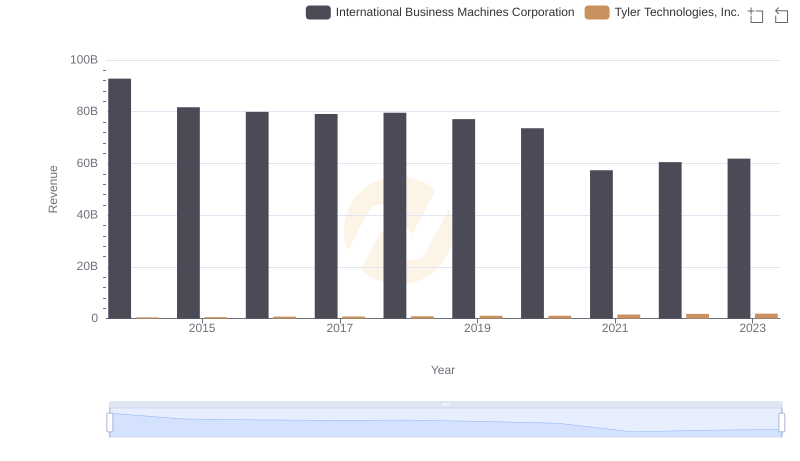
International Business Machines Corporation vs Tyler Technologies, Inc.: Examining Key Revenue Metrics
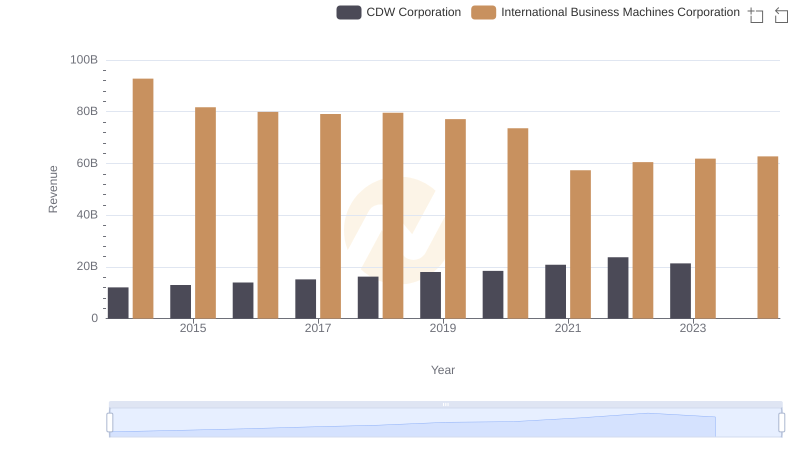
Who Generates More Revenue? International Business Machines Corporation or CDW Corporation
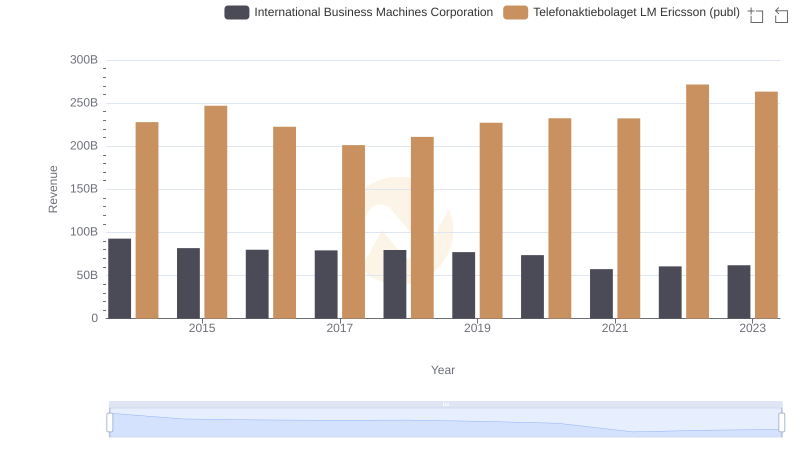
Comparing Revenue Performance: International Business Machines Corporation or Telefonaktiebolaget LM Ericsson (publ)?
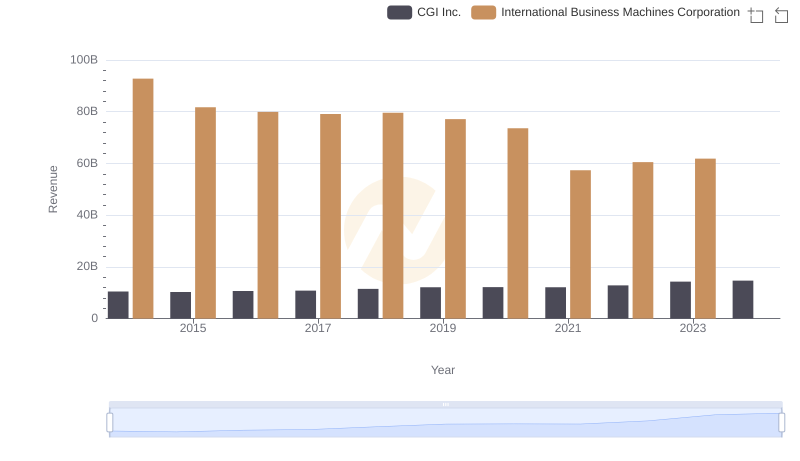
Revenue Insights: International Business Machines Corporation and CGI Inc. Performance Compared
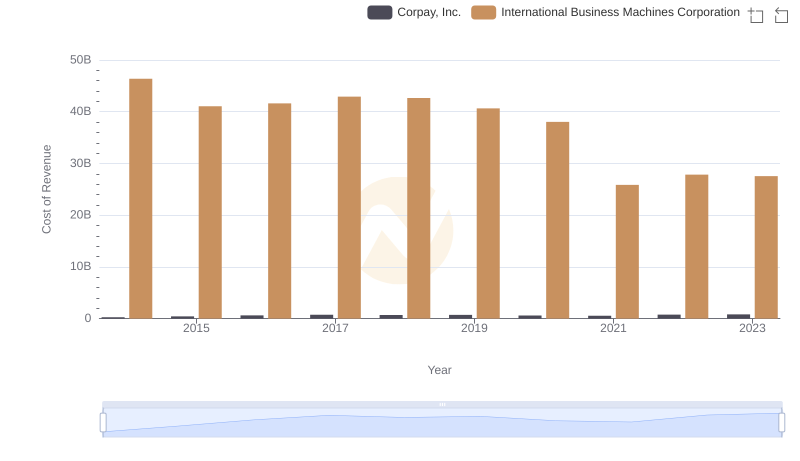
Analyzing Cost of Revenue: International Business Machines Corporation and Corpay, Inc.
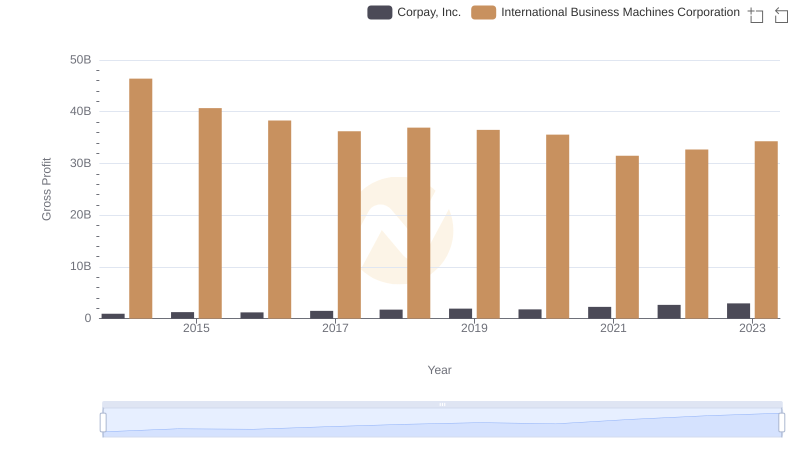
Who Generates Higher Gross Profit? International Business Machines Corporation or Corpay, Inc.
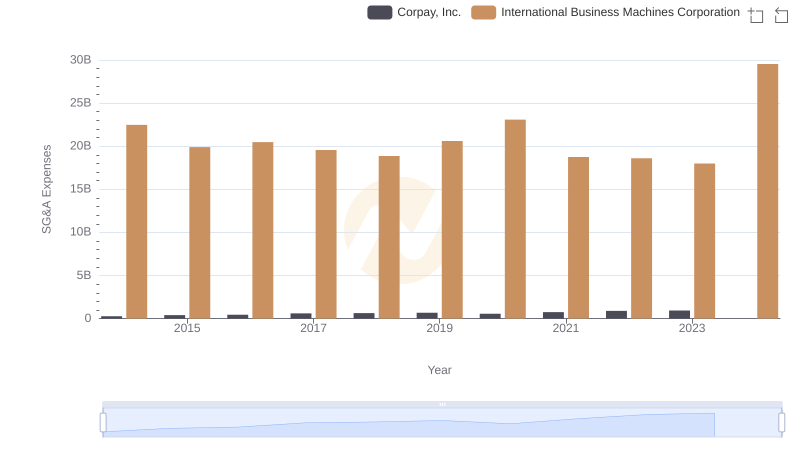
Breaking Down SG&A Expenses: International Business Machines Corporation vs Corpay, Inc.
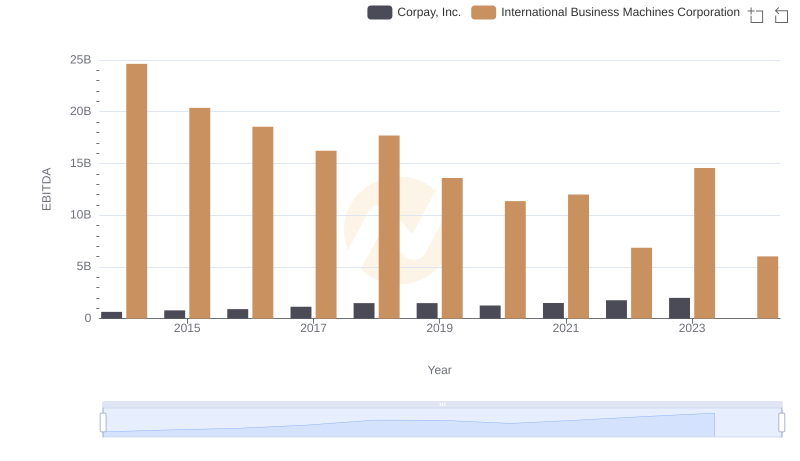
Professional EBITDA Benchmarking: International Business Machines Corporation vs Corpay, Inc.