| __timestamp | Carlisle Companies Incorporated | Lennox International Inc. |
|---|---|---|
| Wednesday, January 1, 2014 | 819500000 | 903300000 |
| Thursday, January 1, 2015 | 1006700000 | 947400000 |
| Friday, January 1, 2016 | 1157300000 | 1076500000 |
| Sunday, January 1, 2017 | 1148000000 | 1125200000 |
| Monday, January 1, 2018 | 1174700000 | 1111200000 |
| Tuesday, January 1, 2019 | 1371700000 | 1079800000 |
| Wednesday, January 1, 2020 | 1137400000 | 1040100000 |
| Friday, January 1, 2021 | 1314700000 | 1188400000 |
| Saturday, January 1, 2022 | 2157400000 | 1284700000 |
| Sunday, January 1, 2023 | 1544000000 | 1547800000 |
| Monday, January 1, 2024 | 1887700000 | 1771900000 |
Data in motion
In the competitive landscape of industrial manufacturing, Lennox International Inc. and Carlisle Companies Incorporated have been pivotal players. Over the past decade, these companies have showcased intriguing trends in their gross profit margins. From 2014 to 2023, Carlisle Companies saw a remarkable 88% increase in gross profit, peaking in 2022. Meanwhile, Lennox International experienced a steady climb, culminating in a 96% rise by 2024. Notably, 2023 marked a pivotal year where Lennox surpassed Carlisle, highlighting its strategic growth. However, data for Carlisle in 2024 remains elusive, leaving room for speculation. This financial narrative underscores the dynamic shifts within the industry, offering insights into strategic maneuvers and market positioning. As these giants continue to evolve, stakeholders and investors alike are keenly observing their trajectories, eager to decipher the next chapter in this industrial saga.
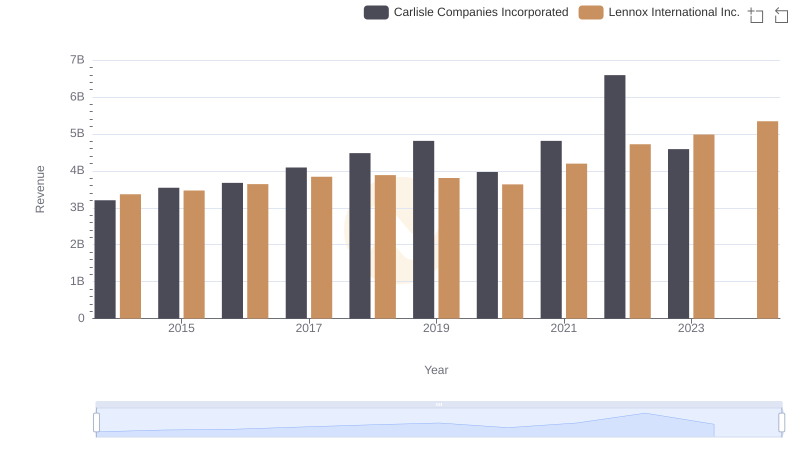
Lennox International Inc. or Carlisle Companies Incorporated: Who Leads in Yearly Revenue?
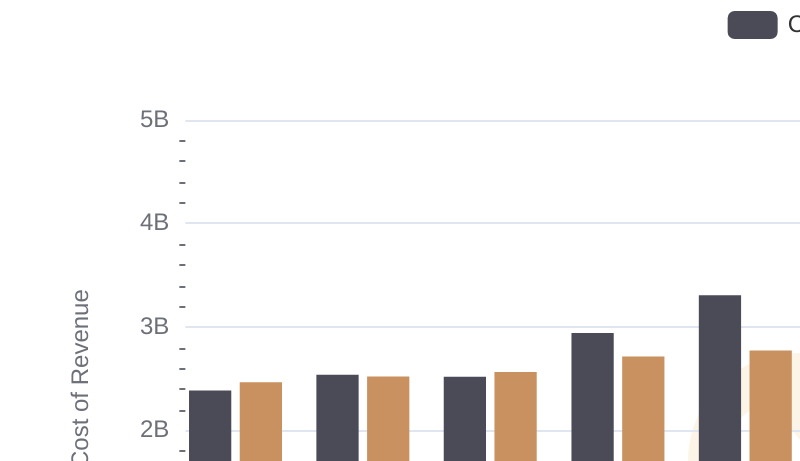
Comparing Cost of Revenue Efficiency: Lennox International Inc. vs Carlisle Companies Incorporated
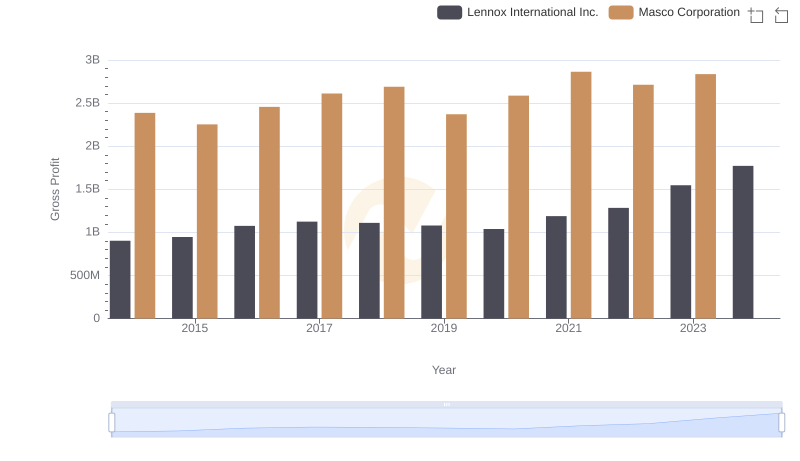
Gross Profit Trends Compared: Lennox International Inc. vs Masco Corporation
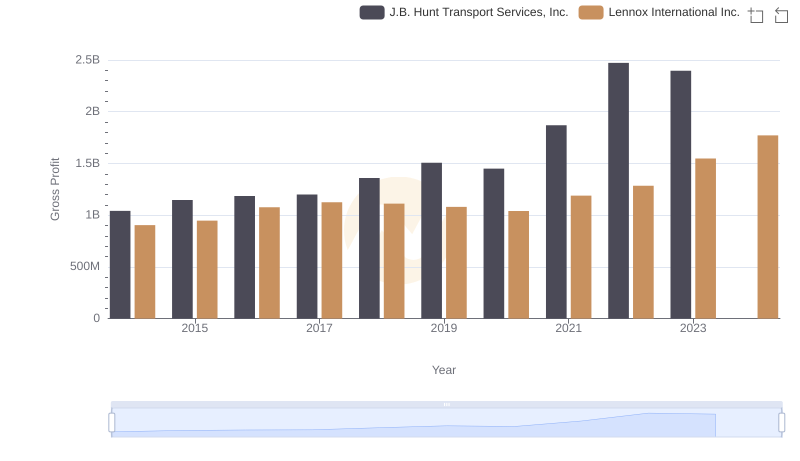
Lennox International Inc. and J.B. Hunt Transport Services, Inc.: A Detailed Gross Profit Analysis
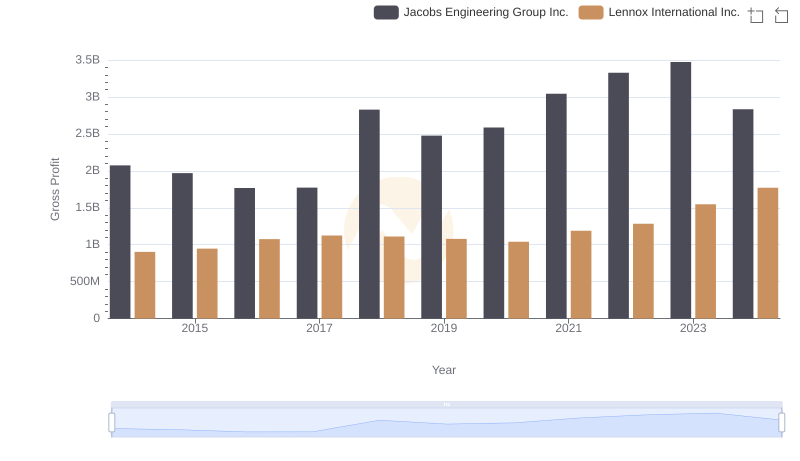
Who Generates Higher Gross Profit? Lennox International Inc. or Jacobs Engineering Group Inc.
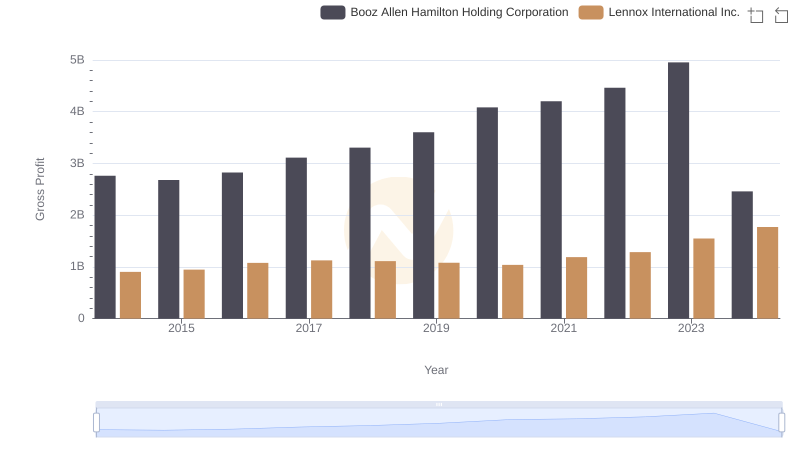
Gross Profit Trends Compared: Lennox International Inc. vs Booz Allen Hamilton Holding Corporation
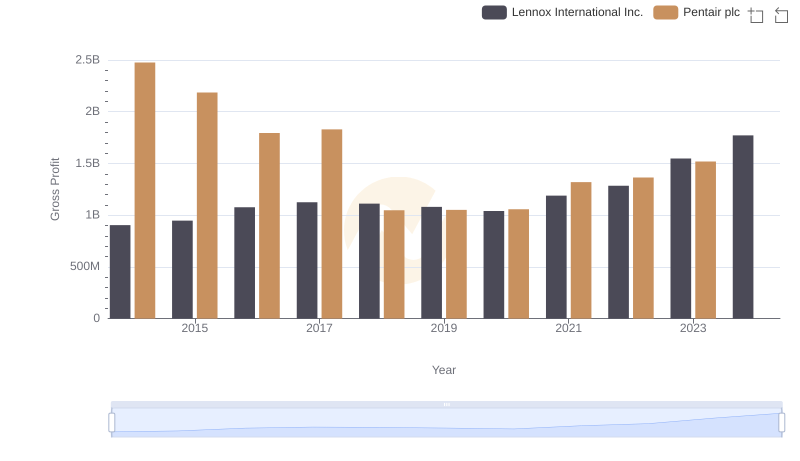
Gross Profit Analysis: Comparing Lennox International Inc. and Pentair plc
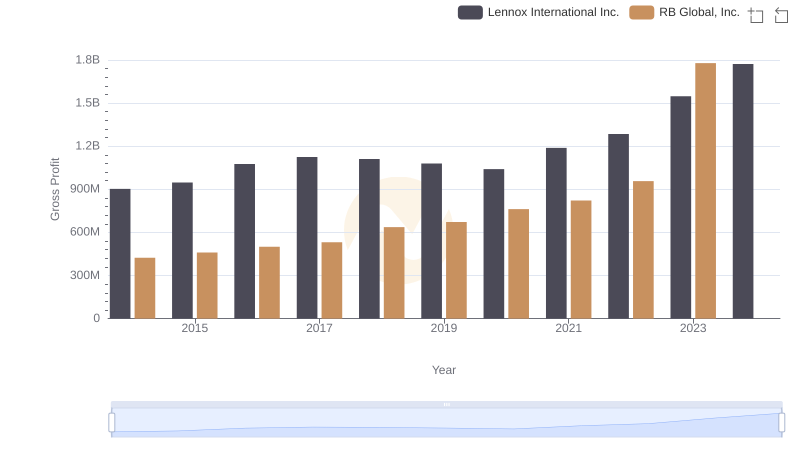
Lennox International Inc. vs RB Global, Inc.: A Gross Profit Performance Breakdown
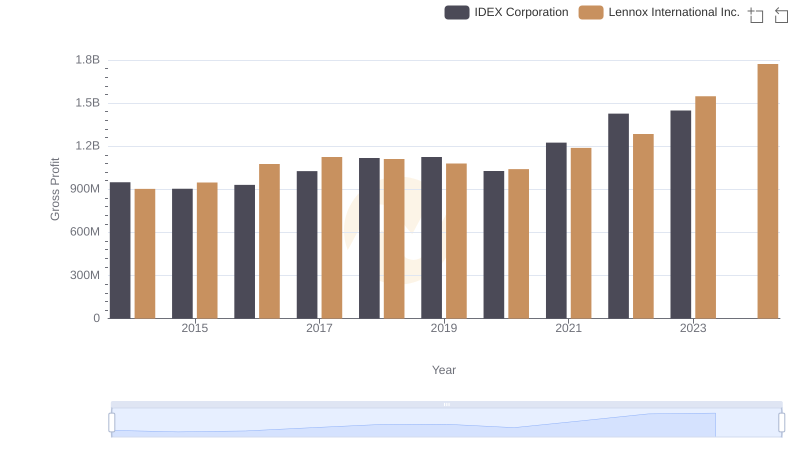
Gross Profit Comparison: Lennox International Inc. and IDEX Corporation Trends
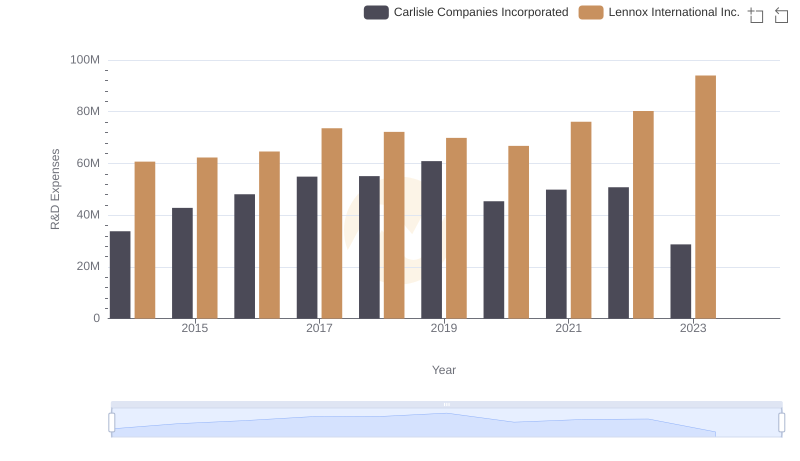
Analyzing R&D Budgets: Lennox International Inc. vs Carlisle Companies Incorporated
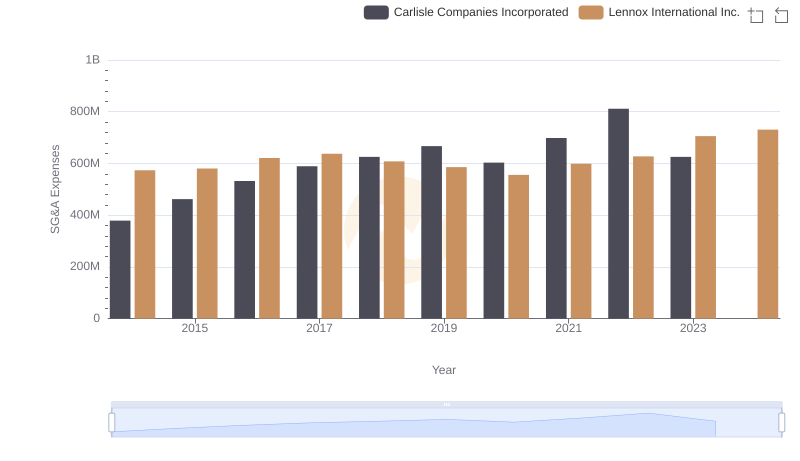
Selling, General, and Administrative Costs: Lennox International Inc. vs Carlisle Companies Incorporated
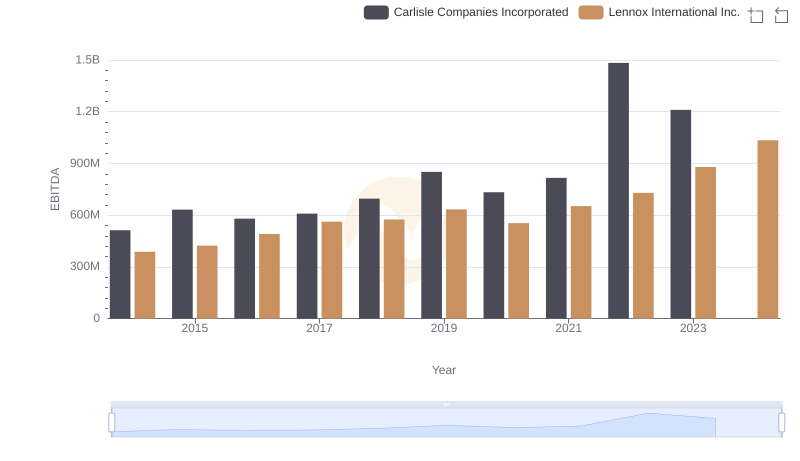
A Side-by-Side Analysis of EBITDA: Lennox International Inc. and Carlisle Companies Incorporated