| __timestamp | Lennox International Inc. | Pentair plc |
|---|---|---|
| Wednesday, January 1, 2014 | 903300000 | 2476000000 |
| Thursday, January 1, 2015 | 947400000 | 2185800000 |
| Friday, January 1, 2016 | 1076500000 | 1794100000 |
| Sunday, January 1, 2017 | 1125200000 | 1829100000 |
| Monday, January 1, 2018 | 1111200000 | 1047700000 |
| Tuesday, January 1, 2019 | 1079800000 | 1051500000 |
| Wednesday, January 1, 2020 | 1040100000 | 1057600000 |
| Friday, January 1, 2021 | 1188400000 | 1319200000 |
| Saturday, January 1, 2022 | 1284700000 | 1364600000 |
| Sunday, January 1, 2023 | 1547800000 | 1519200000 |
| Monday, January 1, 2024 | 1771900000 | 1598800000 |
Unleashing insights
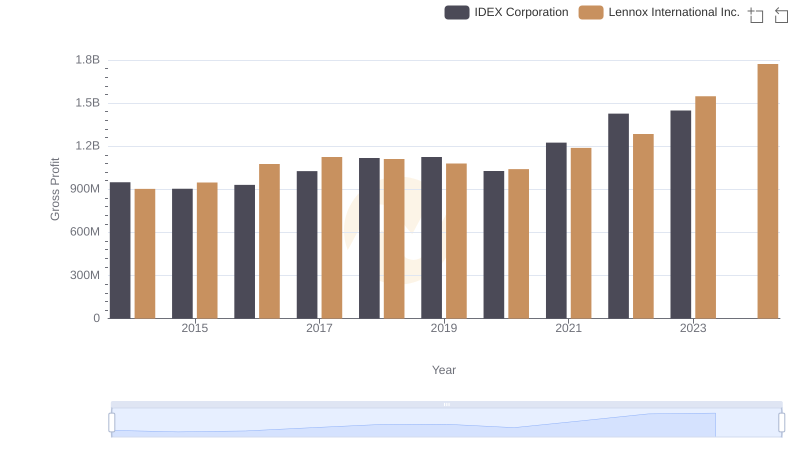
In the competitive landscape of industrial manufacturing, Lennox International Inc. and Pentair plc have showcased intriguing financial trajectories over the past decade. From 2014 to 2023, Lennox International Inc. has seen a robust growth in gross profit, surging by approximately 96% from 2014 to 2023. This upward trend highlights Lennox's strategic prowess in optimizing operational efficiencies and market expansion.
Conversely, Pentair plc experienced a more volatile journey. Starting strong in 2014, Pentair's gross profit peaked early but faced fluctuations, reflecting challenges in market dynamics and operational adjustments. By 2023, Pentair's gross profit was slightly below Lennox's, marking a shift in competitive positioning.
The data for 2024 is incomplete, with Pentair's figures missing, leaving room for speculation on future market dynamics. This analysis underscores the importance of strategic agility in maintaining financial health in the industrial sector.
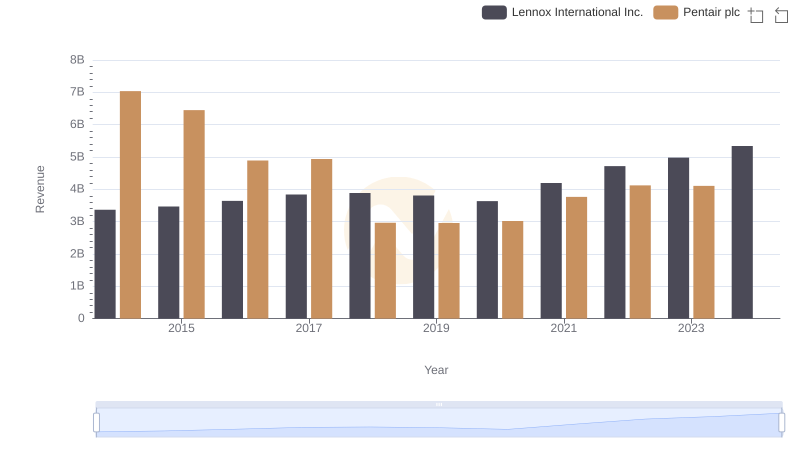
Lennox International Inc. and Pentair plc: A Comprehensive Revenue Analysis
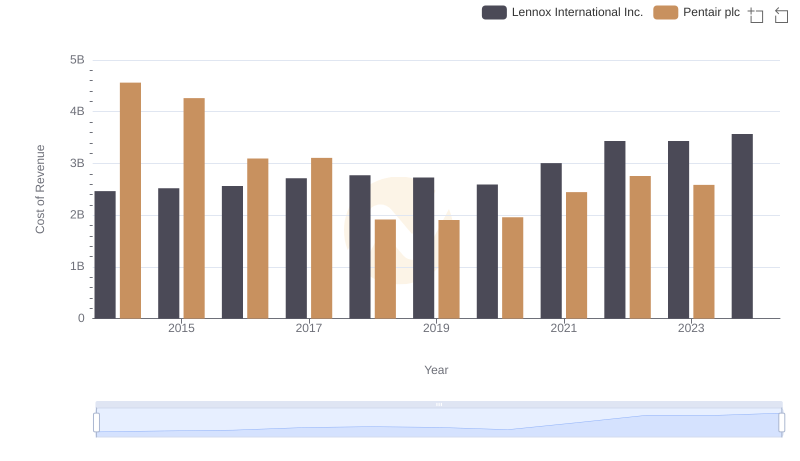
Cost Insights: Breaking Down Lennox International Inc. and Pentair plc's Expenses
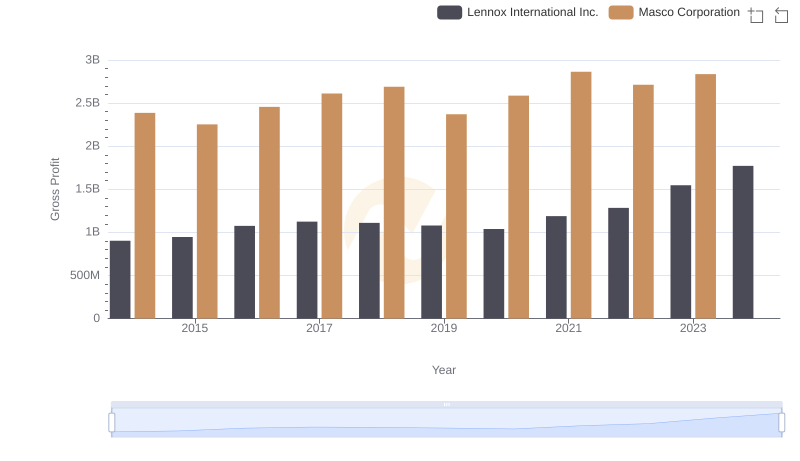
Gross Profit Trends Compared: Lennox International Inc. vs Masco Corporation
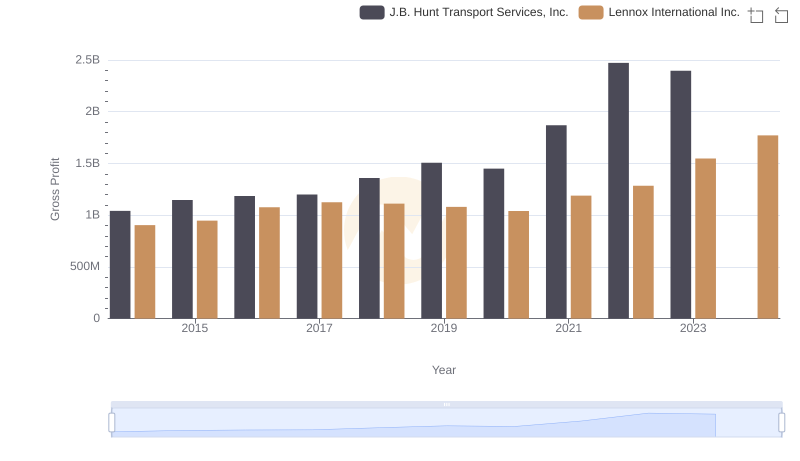
Lennox International Inc. and J.B. Hunt Transport Services, Inc.: A Detailed Gross Profit Analysis
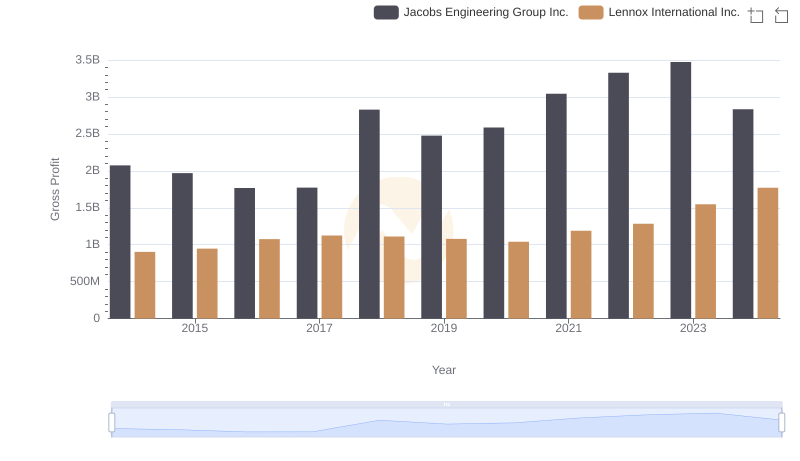
Who Generates Higher Gross Profit? Lennox International Inc. or Jacobs Engineering Group Inc.
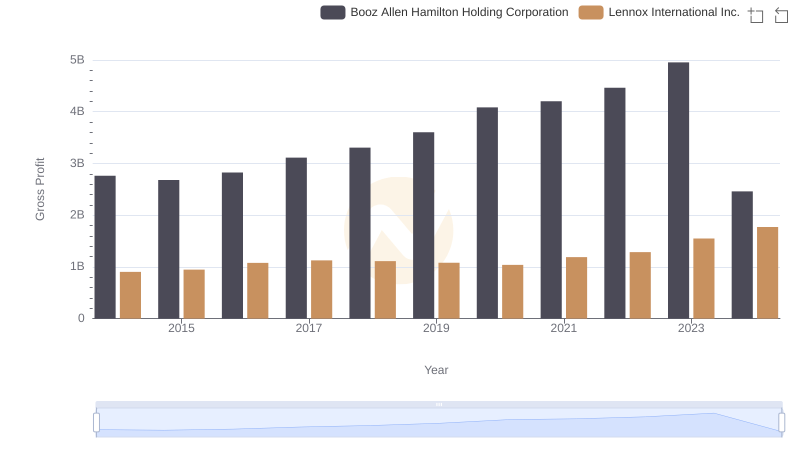
Gross Profit Trends Compared: Lennox International Inc. vs Booz Allen Hamilton Holding Corporation
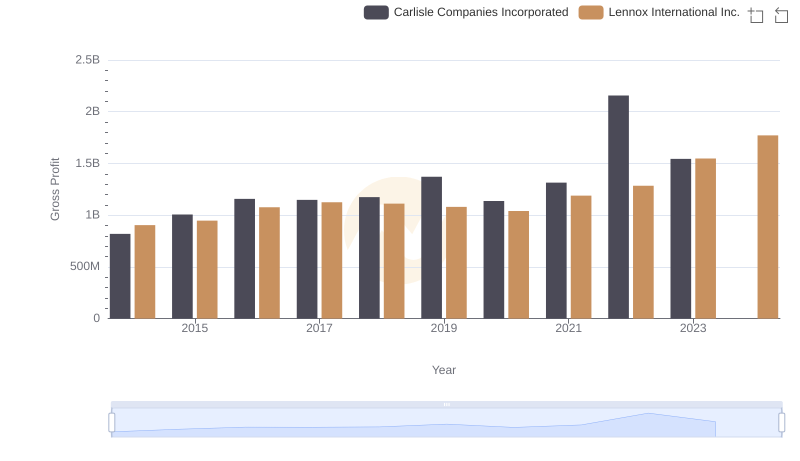
Gross Profit Trends Compared: Lennox International Inc. vs Carlisle Companies Incorporated
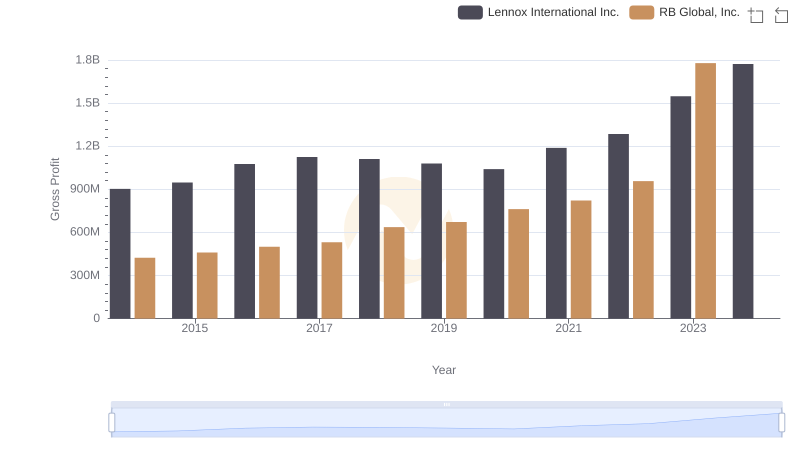
Lennox International Inc. vs RB Global, Inc.: A Gross Profit Performance Breakdown
Gross Profit Comparison: Lennox International Inc. and IDEX Corporation Trends
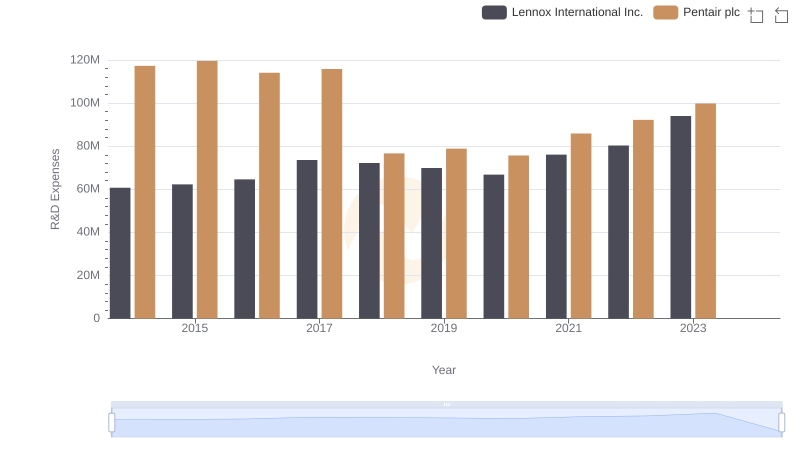
Lennox International Inc. vs Pentair plc: Strategic Focus on R&D Spending
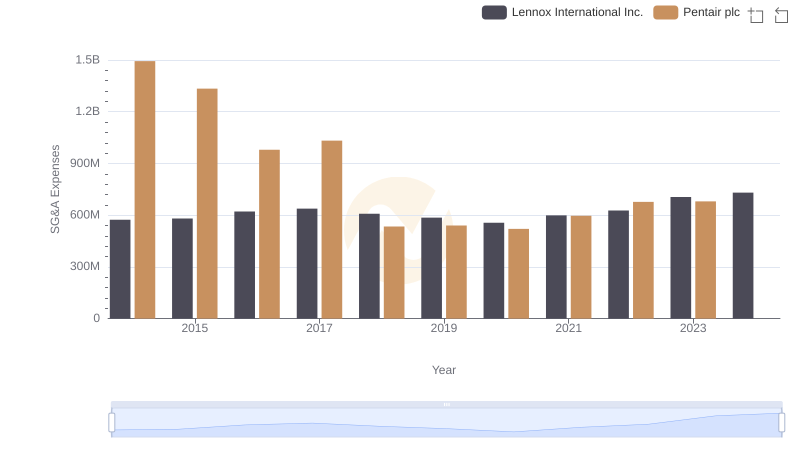
Lennox International Inc. and Pentair plc: SG&A Spending Patterns Compared
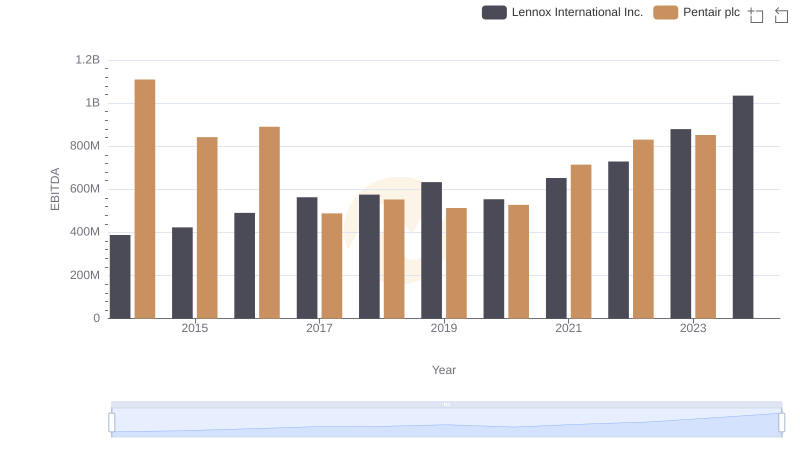
Comparative EBITDA Analysis: Lennox International Inc. vs Pentair plc