| __timestamp | Jacobs Engineering Group Inc. | Lennox International Inc. |
|---|---|---|
| Wednesday, January 1, 2014 | 2073784000 | 903300000 |
| Thursday, January 1, 2015 | 1968338000 | 947400000 |
| Friday, January 1, 2016 | 1767831000 | 1076500000 |
| Sunday, January 1, 2017 | 1772252000 | 1125200000 |
| Monday, January 1, 2018 | 2828370000 | 1111200000 |
| Tuesday, January 1, 2019 | 2477028000 | 1079800000 |
| Wednesday, January 1, 2020 | 2586668000 | 1040100000 |
| Friday, January 1, 2021 | 3043772000 | 1188400000 |
| Saturday, January 1, 2022 | 3327040000 | 1284700000 |
| Sunday, January 1, 2023 | 3473315000 | 1547800000 |
| Monday, January 1, 2024 | 2832756000 | 1771900000 |
Unleashing insights
In the competitive landscape of American industry, Lennox International Inc. and Jacobs Engineering Group Inc. stand as titans in their respective fields. From 2014 to 2024, these companies have showcased their prowess in generating gross profit, a key indicator of financial health and operational efficiency.
Jacobs Engineering has consistently outperformed Lennox in terms of gross profit. In 2023, Jacobs reported a gross profit that was approximately 125% higher than Lennox's. This trend highlights Jacobs' robust business model and strategic market positioning.
While Lennox's gross profit has been lower, it has shown a steady growth trajectory. From 2014 to 2023, Lennox's gross profit increased by about 71%, reflecting its resilience and adaptability in the HVAC industry.
This analysis underscores the dynamic nature of these industries and the strategic maneuvers companies must employ to maintain their competitive edge.
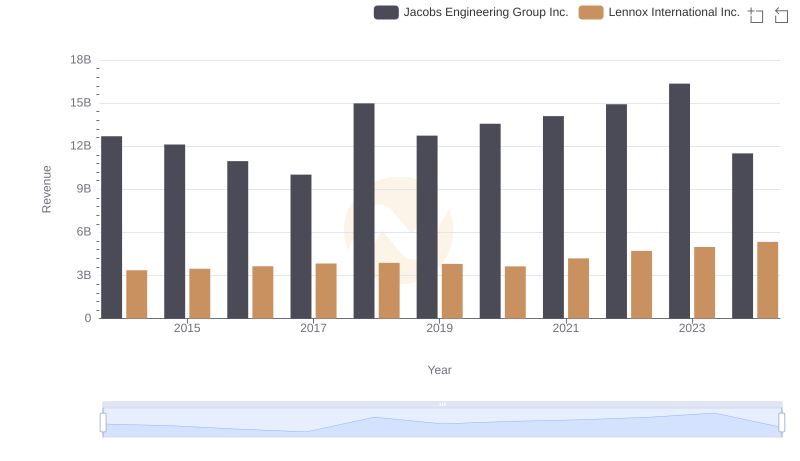
Revenue Showdown: Lennox International Inc. vs Jacobs Engineering Group Inc.
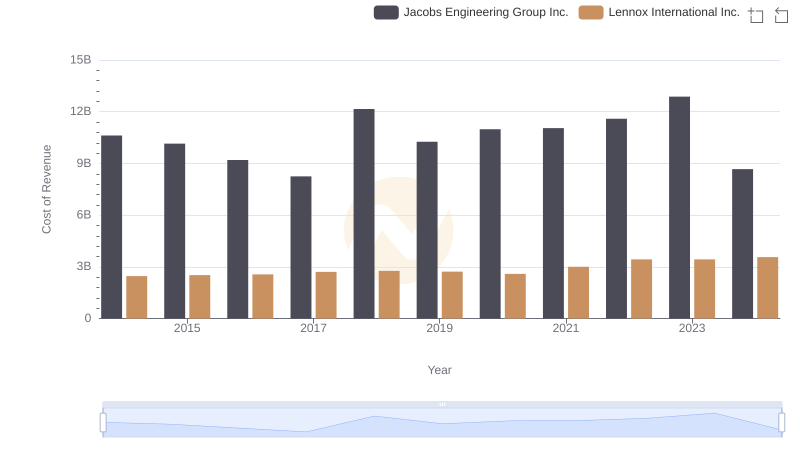
Cost of Revenue Trends: Lennox International Inc. vs Jacobs Engineering Group Inc.
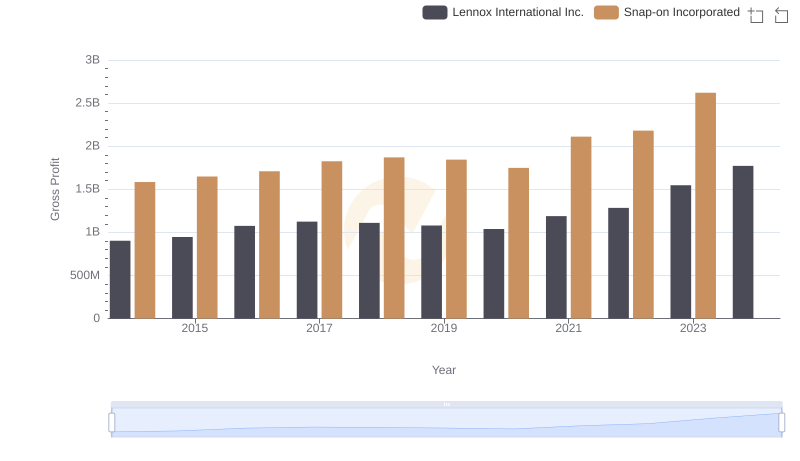
Lennox International Inc. vs Snap-on Incorporated: A Gross Profit Performance Breakdown
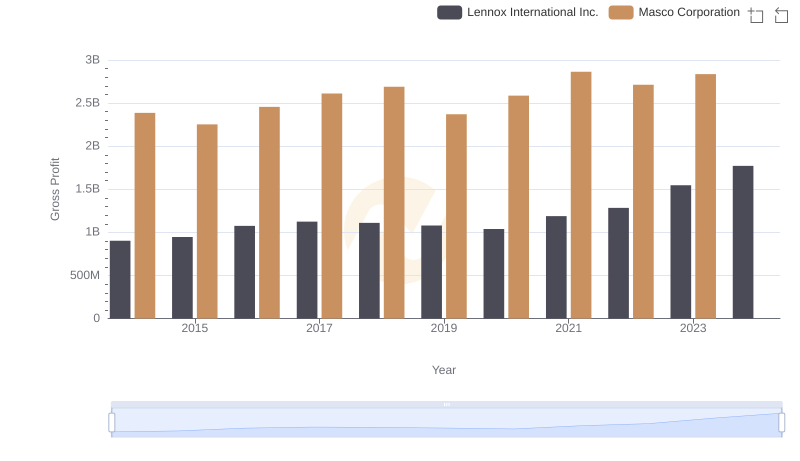
Gross Profit Trends Compared: Lennox International Inc. vs Masco Corporation
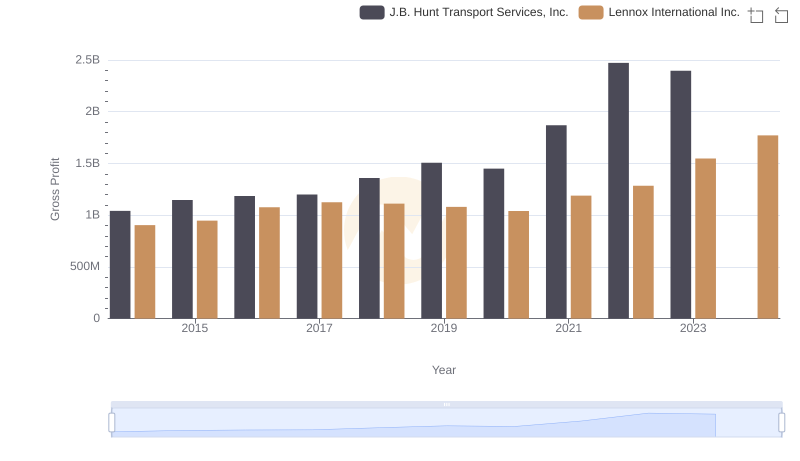
Lennox International Inc. and J.B. Hunt Transport Services, Inc.: A Detailed Gross Profit Analysis
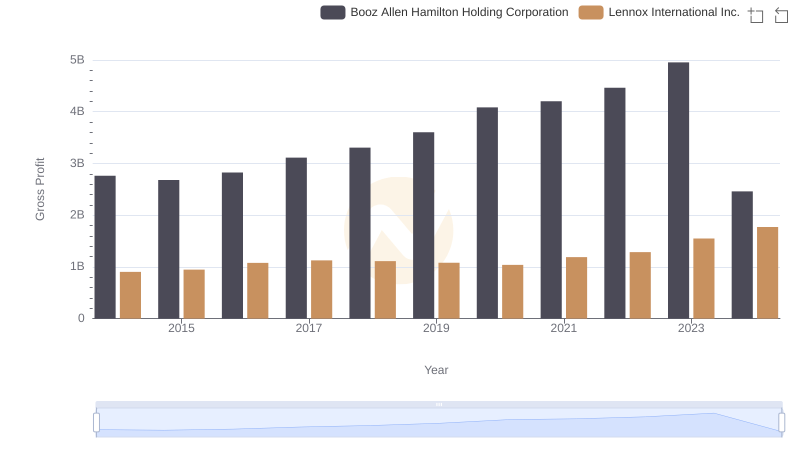
Gross Profit Trends Compared: Lennox International Inc. vs Booz Allen Hamilton Holding Corporation
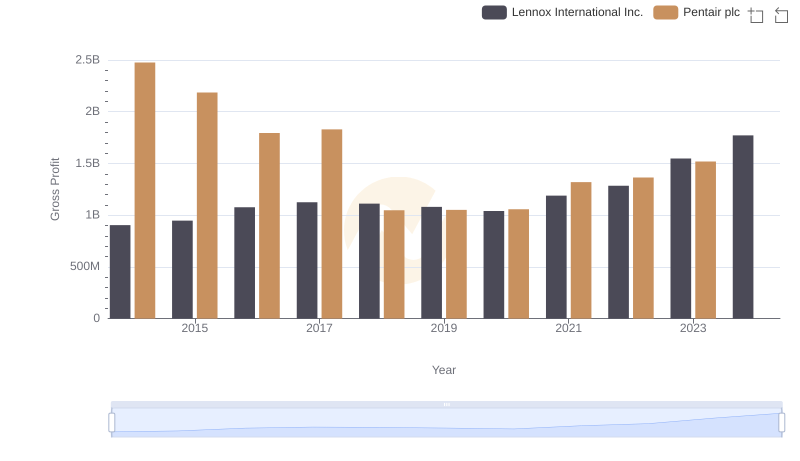
Gross Profit Analysis: Comparing Lennox International Inc. and Pentair plc
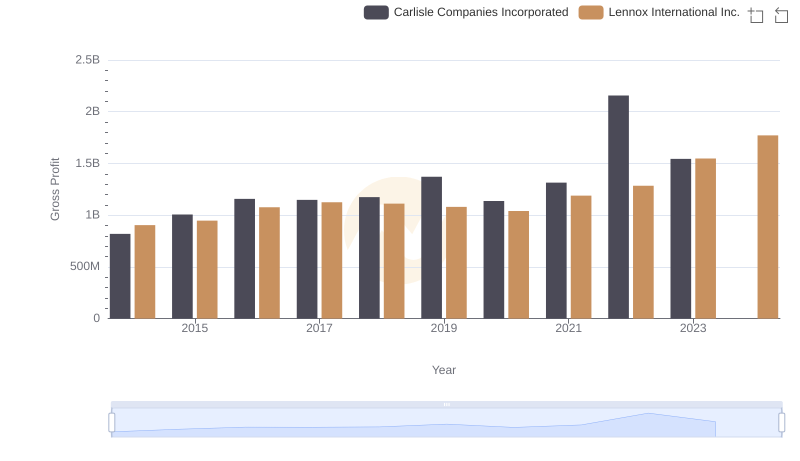
Gross Profit Trends Compared: Lennox International Inc. vs Carlisle Companies Incorporated
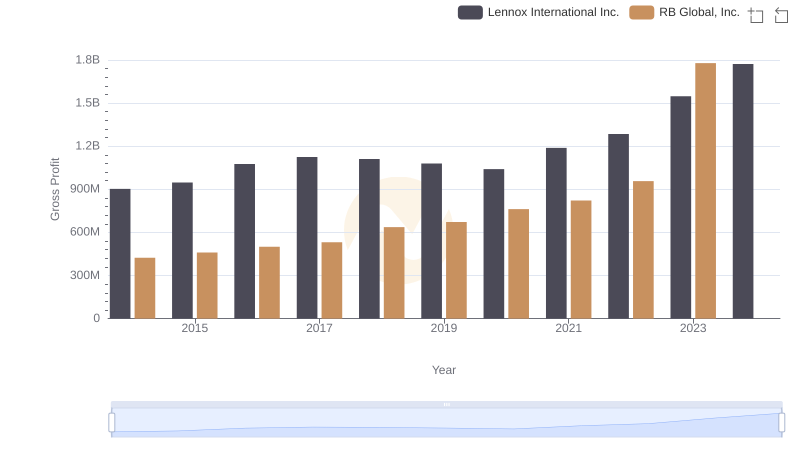
Lennox International Inc. vs RB Global, Inc.: A Gross Profit Performance Breakdown
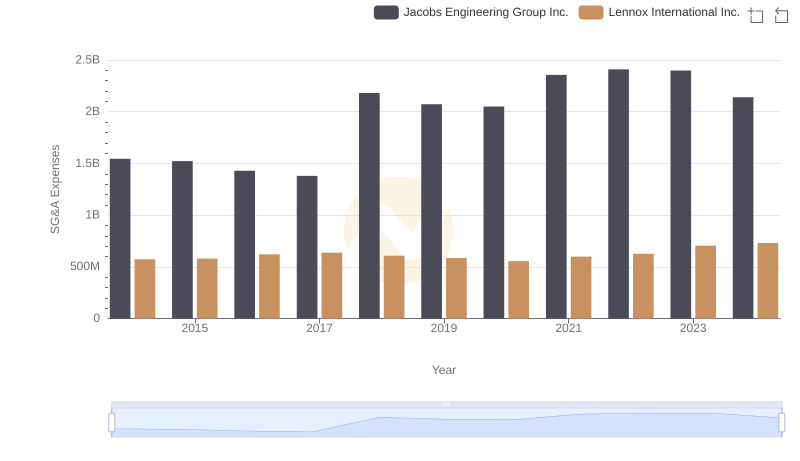
SG&A Efficiency Analysis: Comparing Lennox International Inc. and Jacobs Engineering Group Inc.
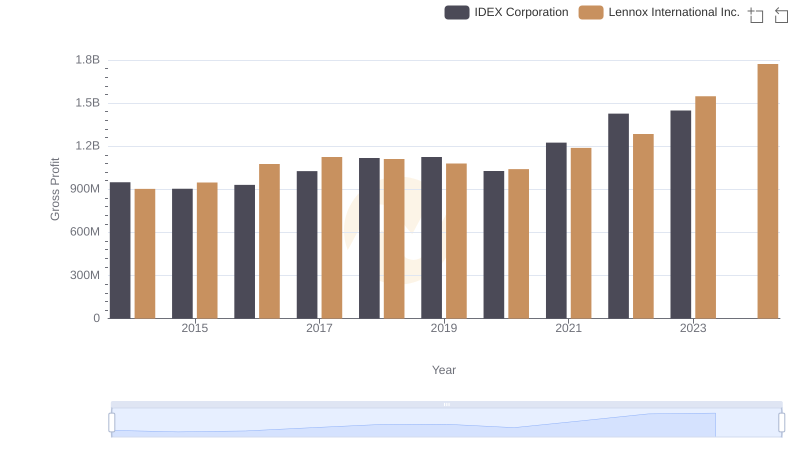
Gross Profit Comparison: Lennox International Inc. and IDEX Corporation Trends
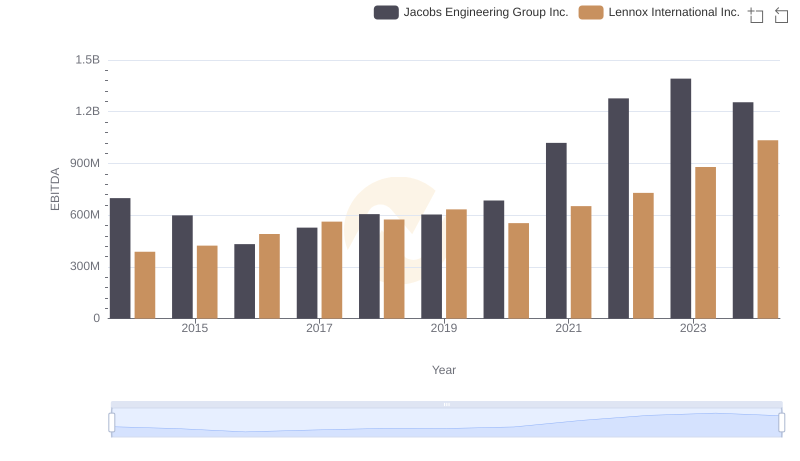
Lennox International Inc. and Jacobs Engineering Group Inc.: A Detailed Examination of EBITDA Performance