| __timestamp | Lennox International Inc. | Stanley Black & Decker, Inc. |
|---|---|---|
| Wednesday, January 1, 2014 | 903300000 | 4102700000 |
| Thursday, January 1, 2015 | 947400000 | 4072000000 |
| Friday, January 1, 2016 | 1076500000 | 4267200000 |
| Sunday, January 1, 2017 | 1125200000 | 4778000000 |
| Monday, January 1, 2018 | 1111200000 | 4901900000 |
| Tuesday, January 1, 2019 | 1079800000 | 4805500000 |
| Wednesday, January 1, 2020 | 1040100000 | 4967900000 |
| Friday, January 1, 2021 | 1188400000 | 5194200000 |
| Saturday, January 1, 2022 | 1284700000 | 4284100000 |
| Sunday, January 1, 2023 | 1547800000 | 4098000000 |
| Monday, January 1, 2024 | 1771900000 | 4514400000 |
Cracking the code
In the competitive landscape of industrial manufacturing, Lennox International Inc. and Stanley Black & Decker, Inc. have showcased distinct trajectories in gross profit over the past decade. From 2014 to 2023, Lennox International Inc. has seen a remarkable growth of approximately 96%, with gross profits rising from around $903 million to an impressive $1.77 billion. This upward trend highlights Lennox's strategic prowess in navigating market challenges and capitalizing on opportunities.
Conversely, Stanley Black & Decker, Inc. experienced a more volatile journey. Despite peaking in 2021 with a gross profit of $5.19 billion, recent years have seen a decline, with 2023 figures dropping to approximately $4.10 billion. This fluctuation underscores the dynamic nature of the industry and the challenges faced by even the most established players. Notably, data for 2024 is missing, leaving room for speculation on future performance.

Lennox International Inc. vs Stanley Black & Decker, Inc.: Annual Revenue Growth Compared
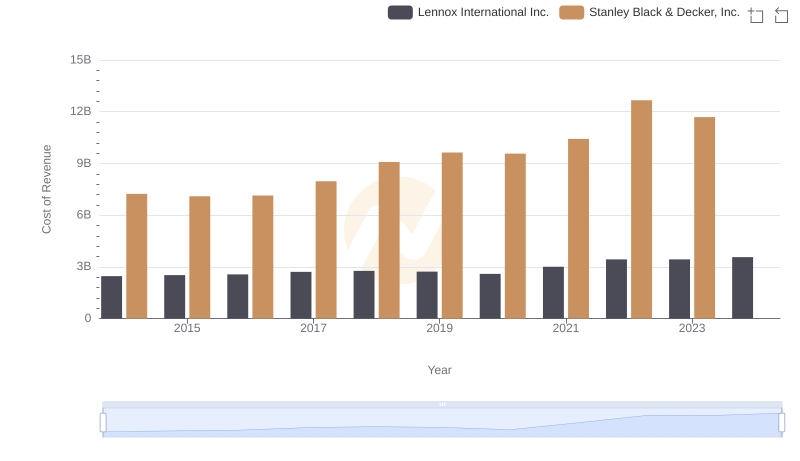
Lennox International Inc. vs Stanley Black & Decker, Inc.: Efficiency in Cost of Revenue Explored
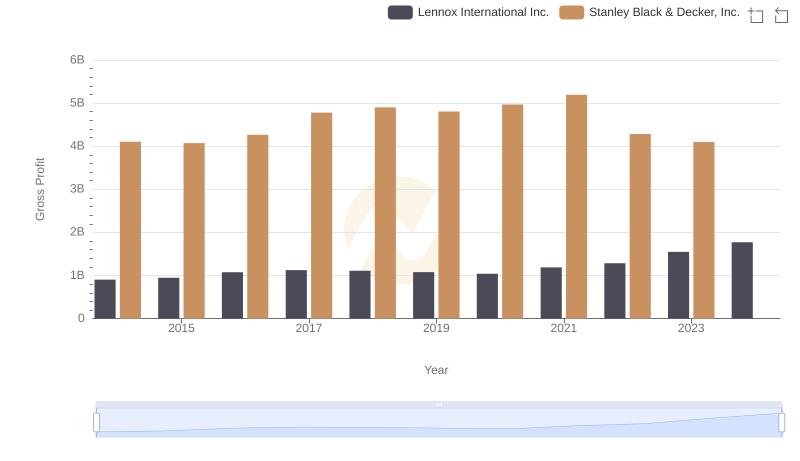
Key Insights on Gross Profit: Lennox International Inc. vs Stanley Black & Decker, Inc.
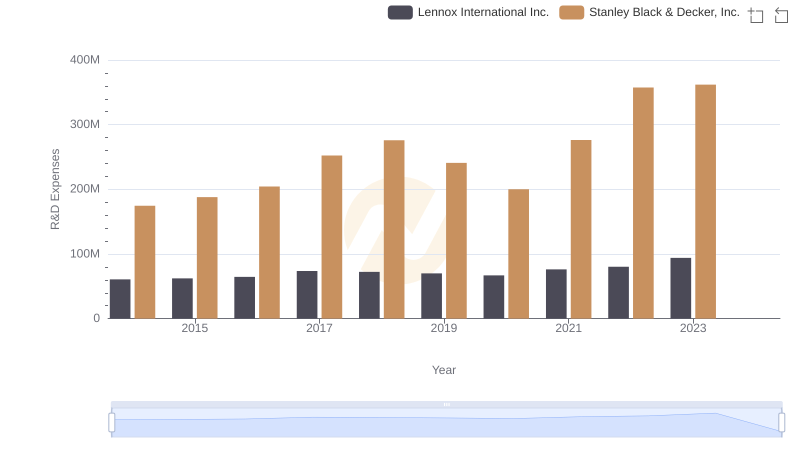
Research and Development Expenses Breakdown: Lennox International Inc. vs Stanley Black & Decker, Inc.
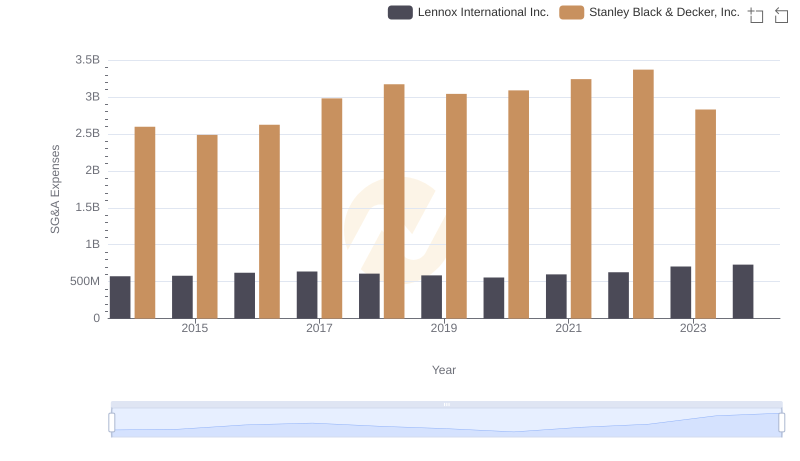
Who Optimizes SG&A Costs Better? Lennox International Inc. or Stanley Black & Decker, Inc.

A Professional Review of EBITDA: Lennox International Inc. Compared to Stanley Black & Decker, Inc.
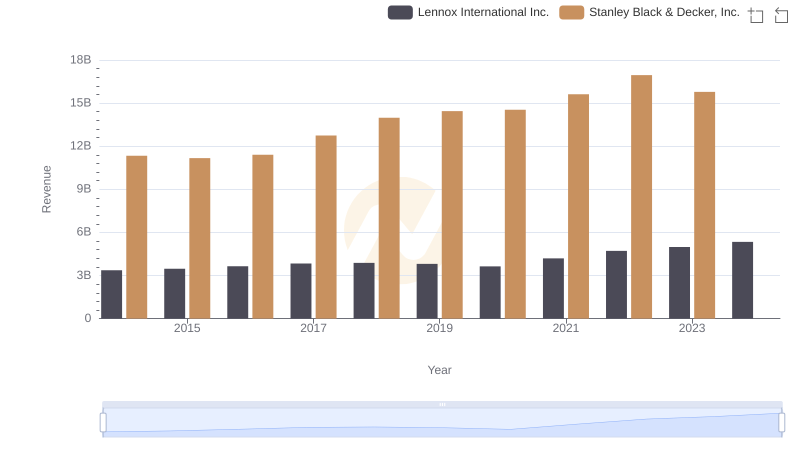
Lennox International Inc. and Stanley Black & Decker, Inc.: A Comprehensive Revenue Analysis

Analyzing Cost of Revenue: Lennox International Inc. and Stanley Black & Decker, Inc.
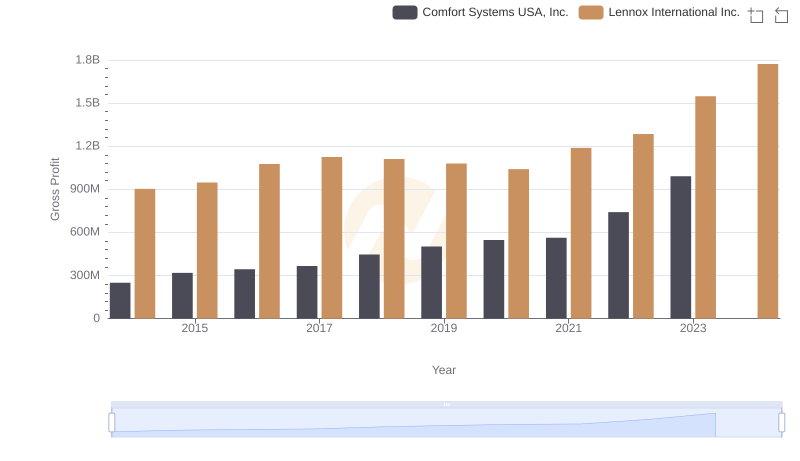
Lennox International Inc. and Comfort Systems USA, Inc.: A Detailed Gross Profit Analysis

Research and Development: Comparing Key Metrics for Lennox International Inc. and Stanley Black & Decker, Inc.

Comparing SG&A Expenses: Lennox International Inc. vs Stanley Black & Decker, Inc. Trends and Insights

Professional EBITDA Benchmarking: Lennox International Inc. vs Stanley Black & Decker, Inc.