| __timestamp | Lennox International Inc. | Saia, Inc. |
|---|---|---|
| Wednesday, January 1, 2014 | 903300000 | 159268000 |
| Thursday, January 1, 2015 | 947400000 | 154120000 |
| Friday, January 1, 2016 | 1076500000 | 159502000 |
| Sunday, January 1, 2017 | 1125200000 | 175046000 |
| Monday, January 1, 2018 | 1111200000 | 230070000 |
| Tuesday, January 1, 2019 | 1079800000 | 249653000 |
| Wednesday, January 1, 2020 | 1040100000 | 283848000 |
| Friday, January 1, 2021 | 1188400000 | 451687000 |
| Saturday, January 1, 2022 | 1284700000 | 590963000 |
| Sunday, January 1, 2023 | 1547800000 | 598932000 |
| Monday, January 1, 2024 | 1771900000 |
Infusing magic into the data realm
In the competitive landscape of the HVAC and logistics industries, Lennox International Inc. and Saia, Inc. have shown distinct trajectories in their gross profit trends over the past decade. From 2014 to 2023, Lennox International Inc. has seen a robust growth of approximately 96%, with its gross profit rising from around $903 million to an impressive $1.55 billion. This growth underscores Lennox's strategic positioning and operational efficiency in the HVAC sector.
Conversely, Saia, Inc., a key player in the logistics industry, has experienced a remarkable 276% increase in gross profit, climbing from $159 million in 2014 to nearly $599 million in 2023. This surge highlights Saia's successful expansion and adaptation in a rapidly evolving market.
While Lennox's data for 2024 is available, Saia's figures remain undisclosed, leaving room for speculation on its future performance.
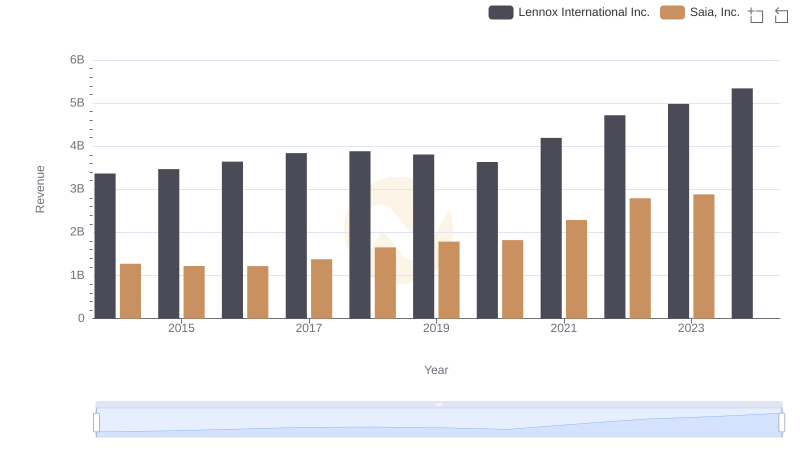
Revenue Insights: Lennox International Inc. and Saia, Inc. Performance Compared
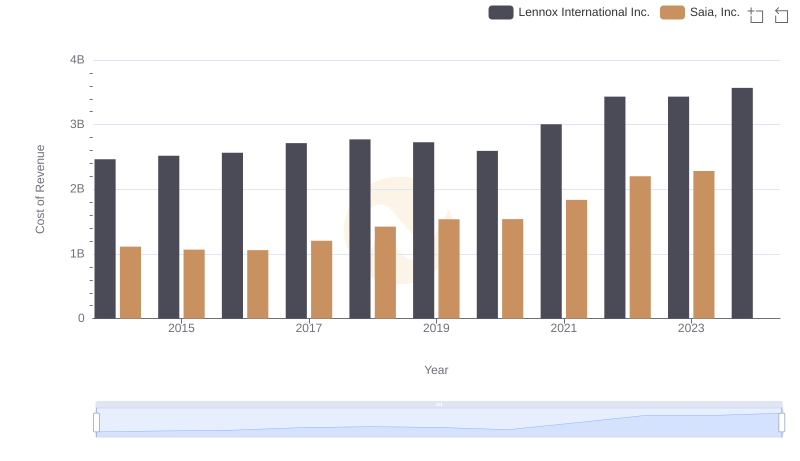
Cost Insights: Breaking Down Lennox International Inc. and Saia, Inc.'s Expenses
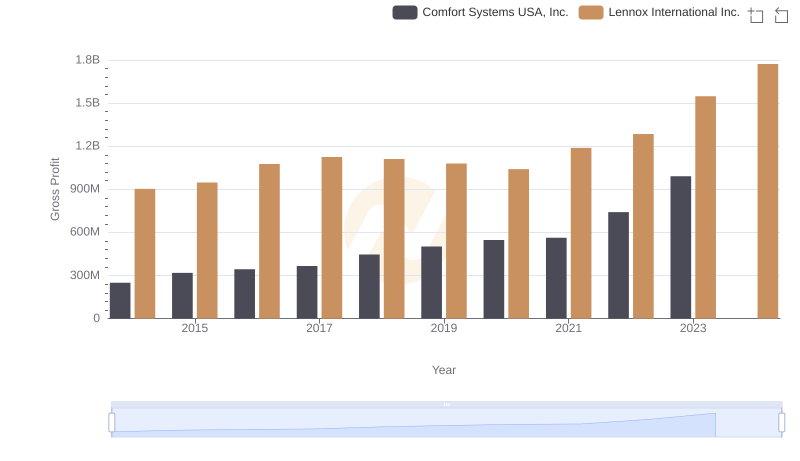
Lennox International Inc. and Comfort Systems USA, Inc.: A Detailed Gross Profit Analysis
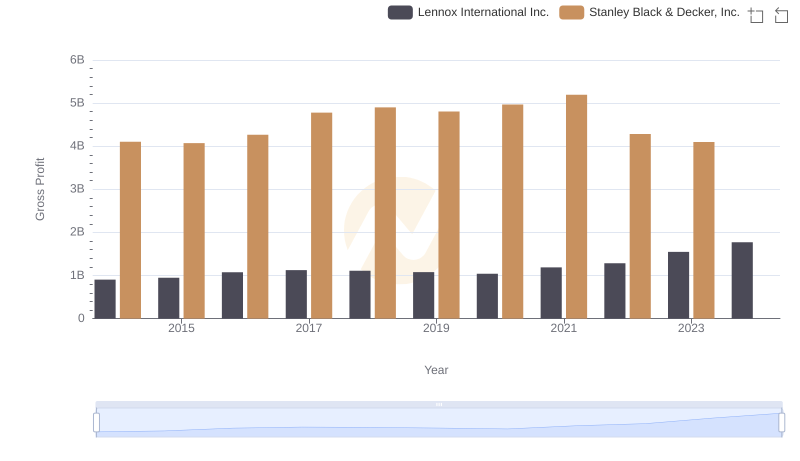
Lennox International Inc. vs Stanley Black & Decker, Inc.: A Gross Profit Performance Breakdown
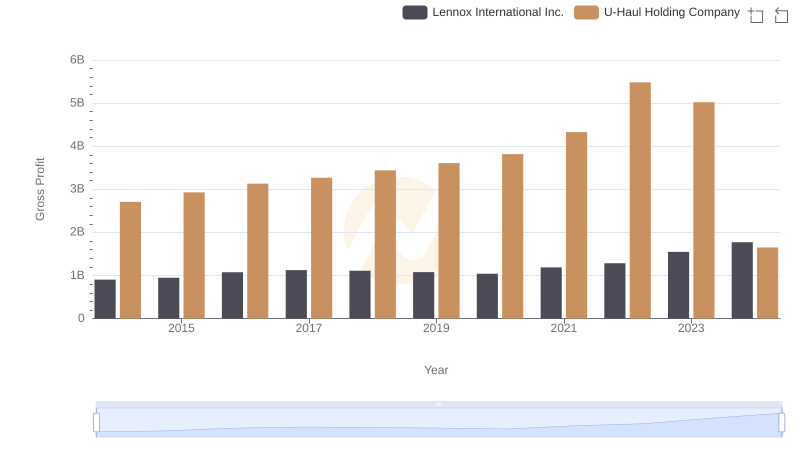
Lennox International Inc. vs U-Haul Holding Company: A Gross Profit Performance Breakdown
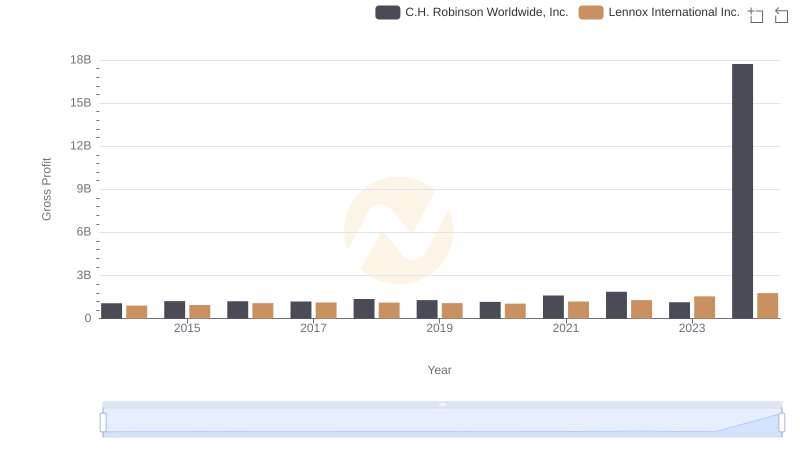
Gross Profit Analysis: Comparing Lennox International Inc. and C.H. Robinson Worldwide, Inc.
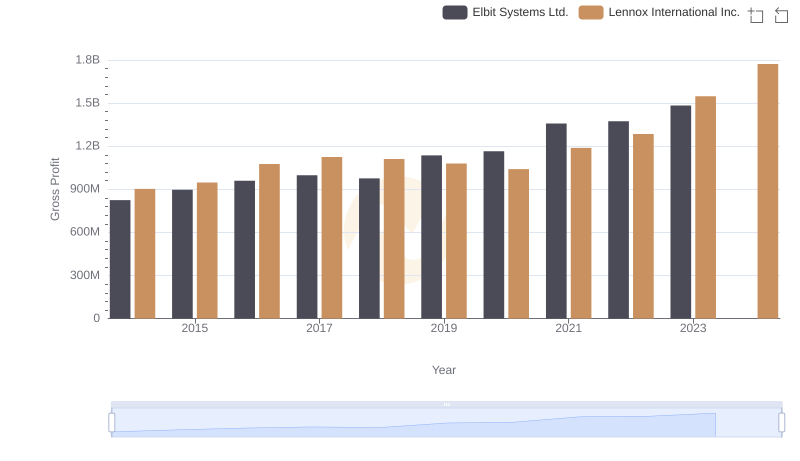
Gross Profit Comparison: Lennox International Inc. and Elbit Systems Ltd. Trends
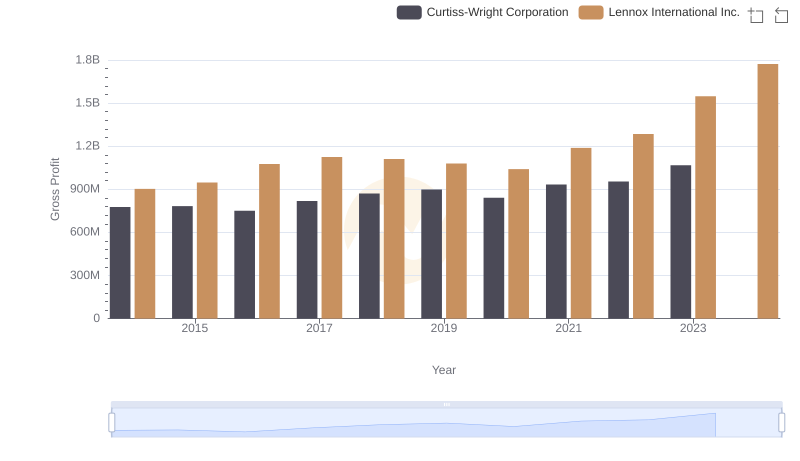
Gross Profit Trends Compared: Lennox International Inc. vs Curtiss-Wright Corporation
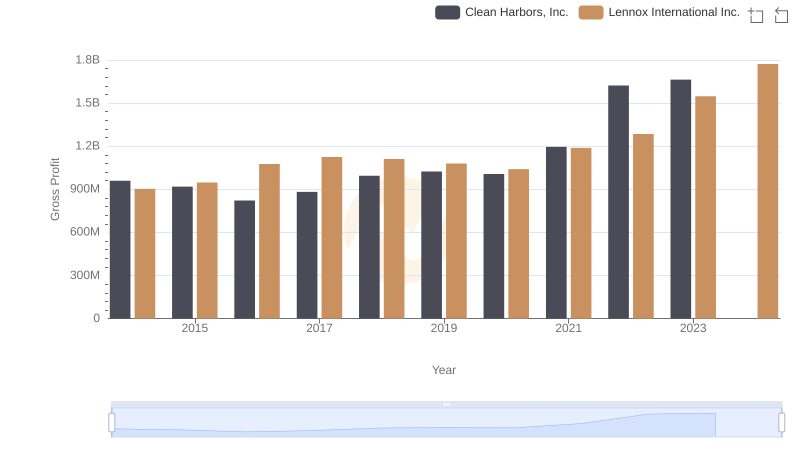
Gross Profit Trends Compared: Lennox International Inc. vs Clean Harbors, Inc.

Lennox International Inc. vs Saia, Inc.: SG&A Expense Trends
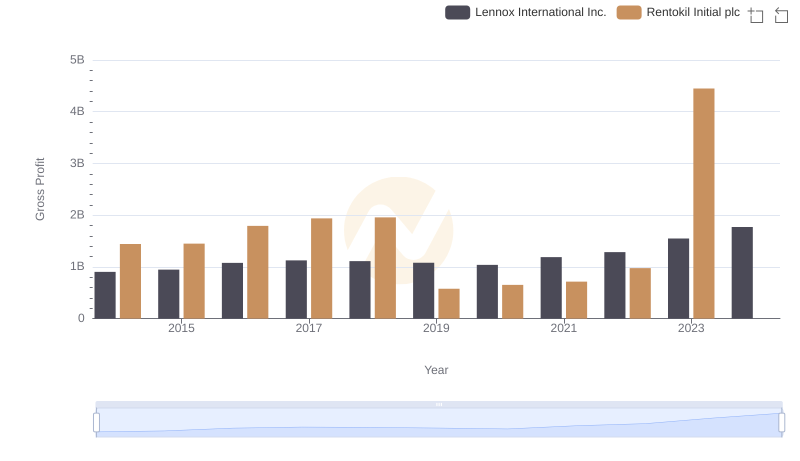
Gross Profit Comparison: Lennox International Inc. and Rentokil Initial plc Trends
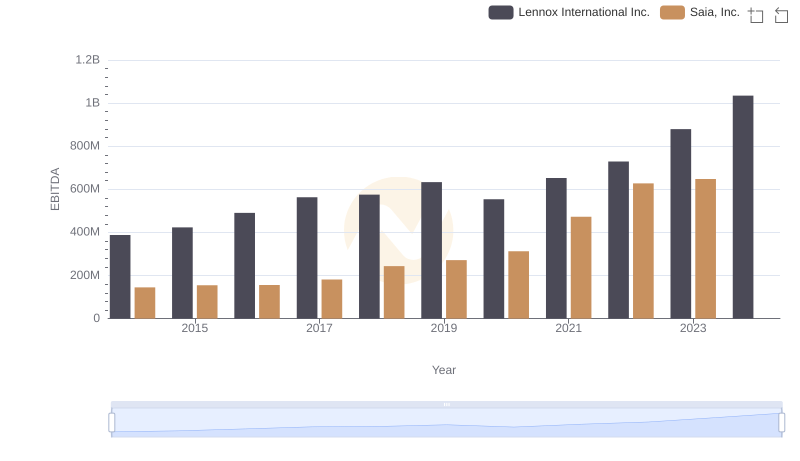
Comprehensive EBITDA Comparison: Lennox International Inc. vs Saia, Inc.